Data and AI Training
Home | Prices | Contact Us | Courses: Power BI - Excel - Python - SQL - Generative AI - Visualising Data - Analysing Data
Descriptive Statistics
Mean, Median and Mode
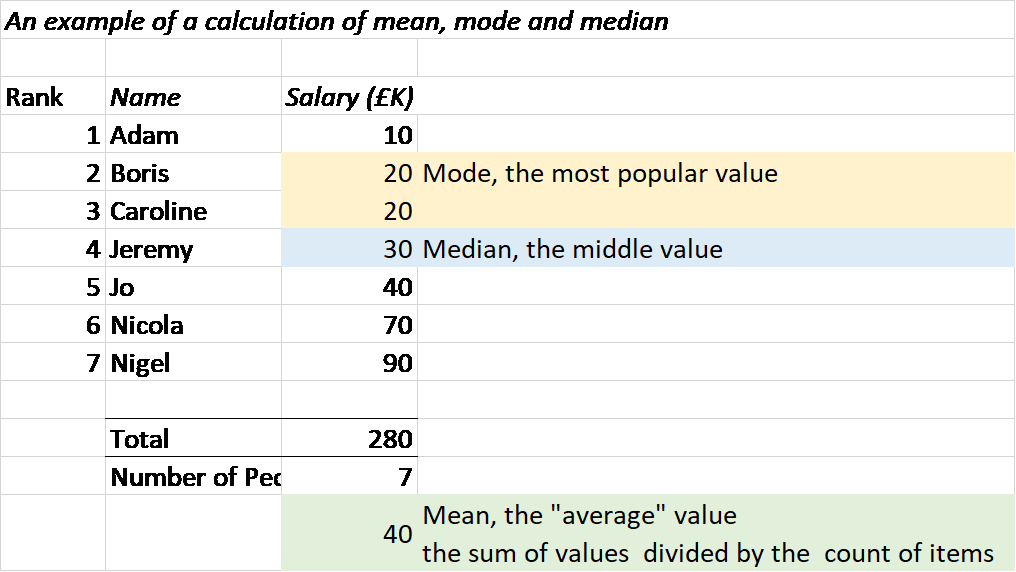
Mean, Median and Mode are all measures of central tendency.
- Mean, a.k.a. average, is sum of values divided by count of values.
- Median – if we order from smallest to largest, this will be the middle value. For an even number of values, we have two middle values and we split the difference.
- Mode – the most popular value
Question: What are the mean, median and mode of the data below?
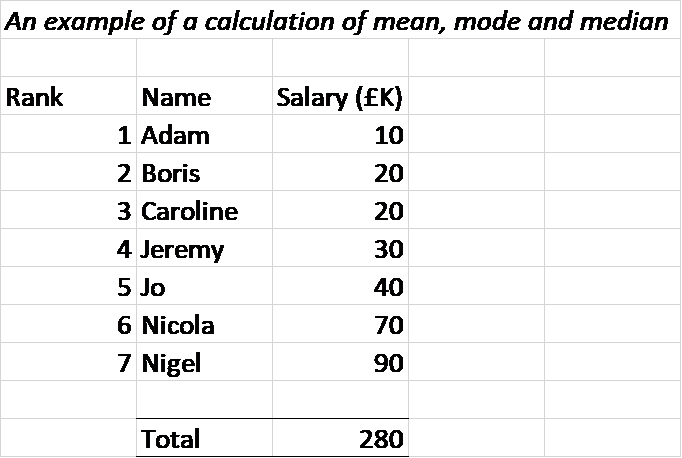
Answer: What are the mean, median and mode of the data below?
Standard Deviation
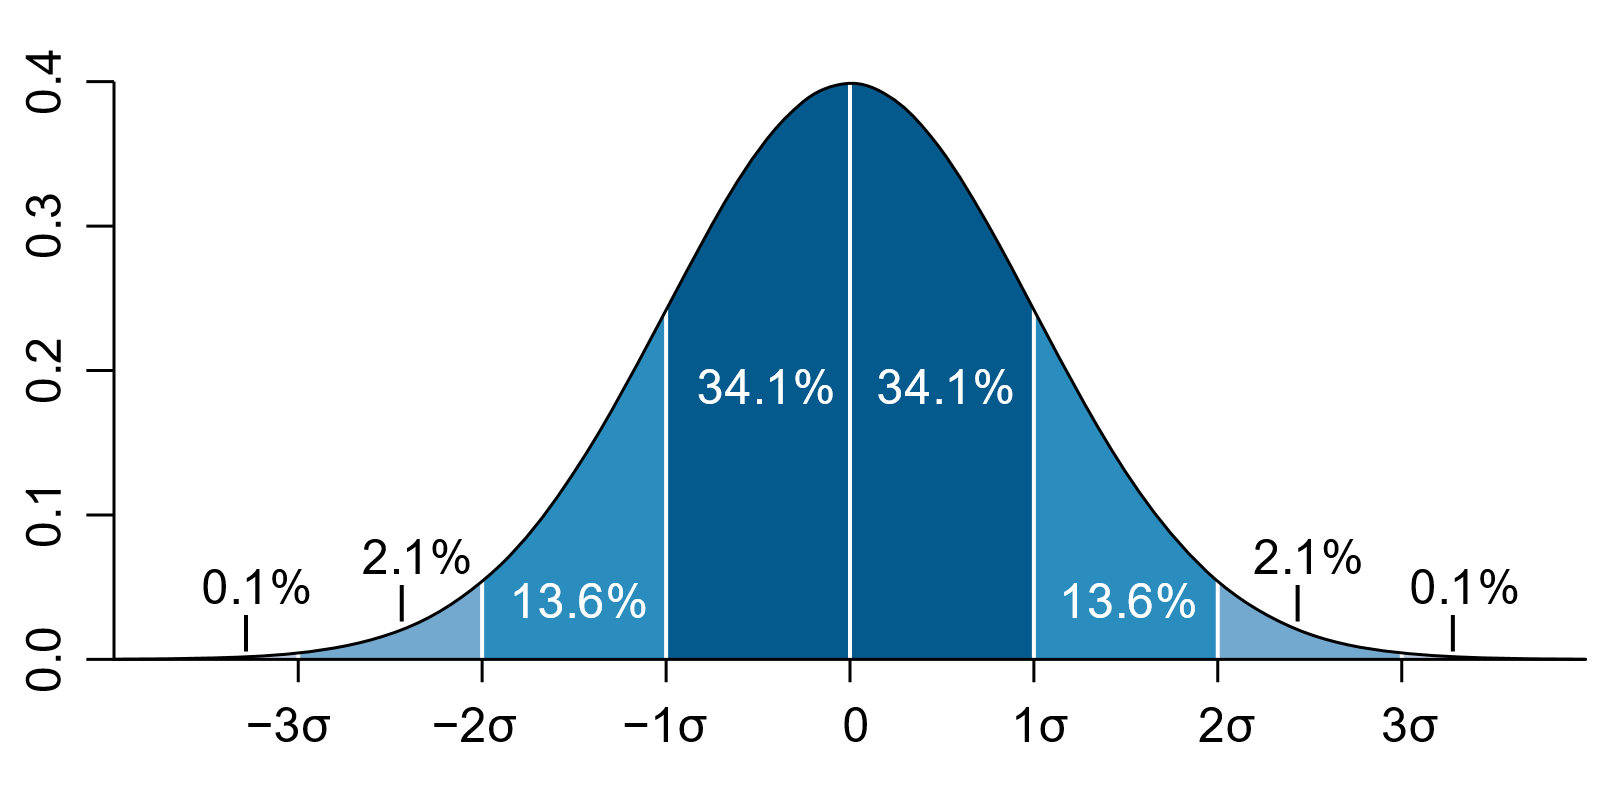
The standard deviation (SD) is a measure of how spread out the numbers are.
In a normal (bell shaped) curve
- 68% within 1 SD of the mean
- 95% within 2 SD of the mean
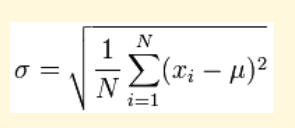
The Standard Deviation formula
A cautionary tale – Anscombe’s Quartet
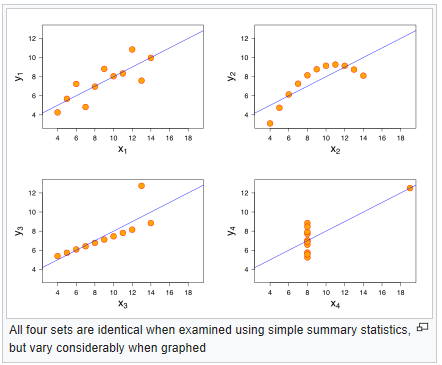
Source: Wikipedia