Data and AI Training
Home | Prices | Contact Us | Courses: Power BI - Excel - Python - SQL - Generative AI - Visualising Data - Analysing Data
Predictive Analysis
“Far better an approximate answer to the right question, which is often vague, than the exact answer to the wrong question, which can always be made precise” – John Tukey
What questions can data analysis answer?
- Is there a trend? Are things going well or badly?
- Which is better / bigger?
- Is this an A or a B? (classification)
- Can we estimate how much or how many?
- Is this an anomaly?
- Is there a pattern in the data?
Regression, Classification and Clustering
An algorithm is a recipe for solving a (numerical) problem. In data science, there are three types of algorithm:
- How much / many? – Regression
- Is it an A or a B? – Classification
- Is there a structure to this data? – Clustering
Regression and classification are supervised – we can train the model with known examples.
Clustering is unsupervised (and harder)
(Supervised) Data Science Process
- Train Algorithm with some data -> Model
- Test that model works well
- Model + New Data -> Predictions
Two examples of regression
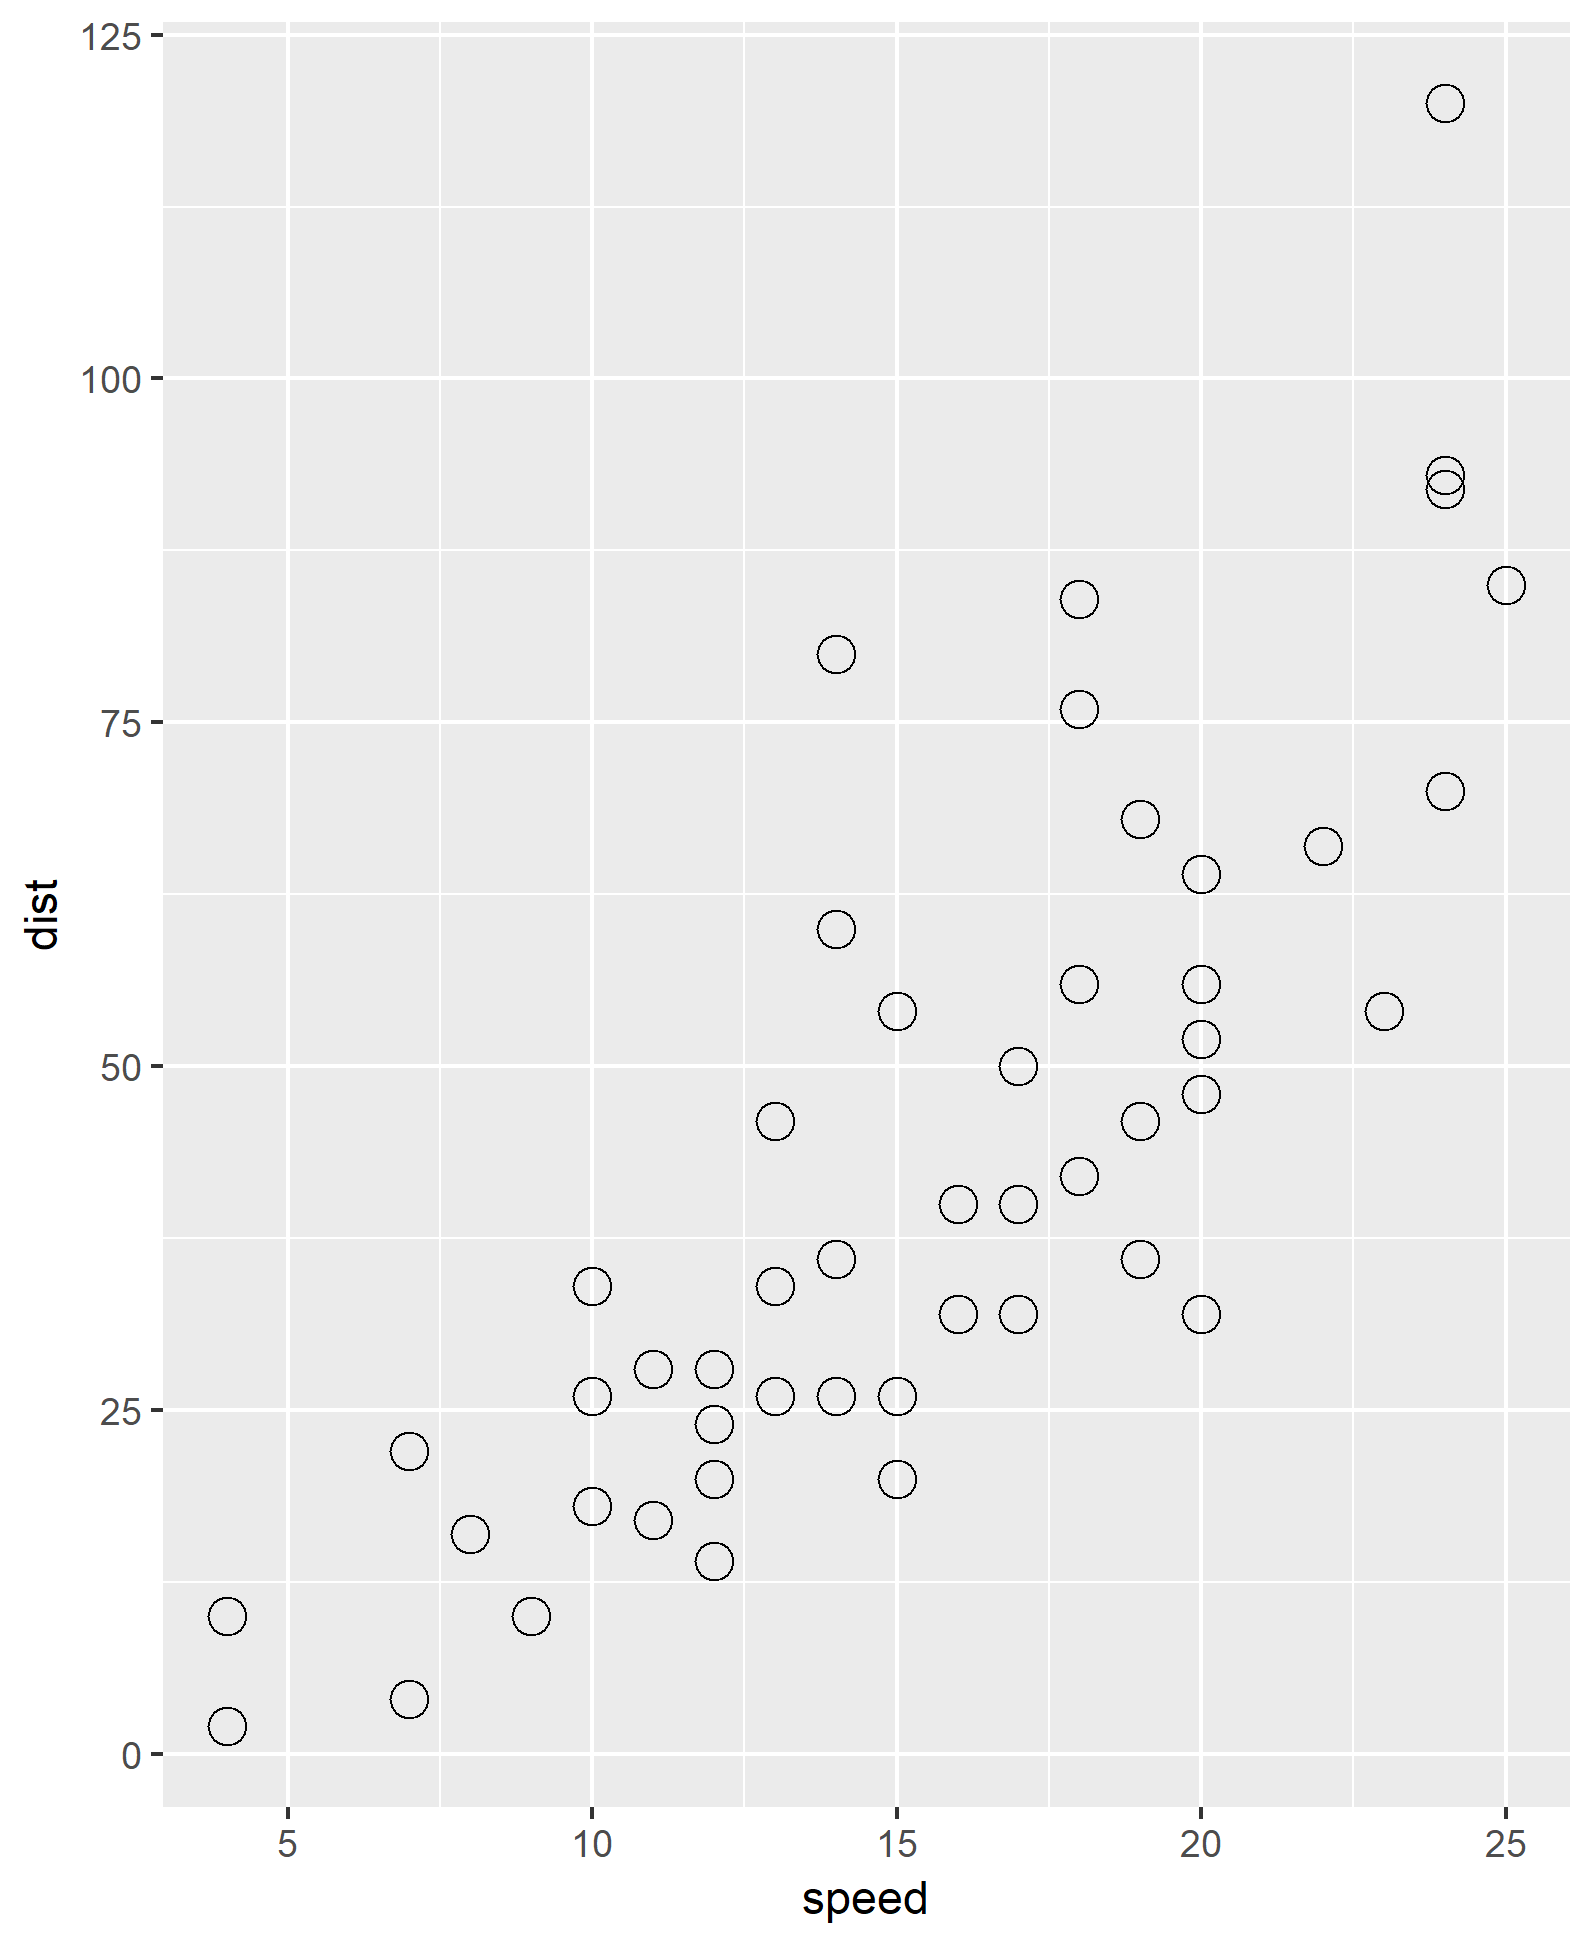
What is the stopping distance for a given speed?
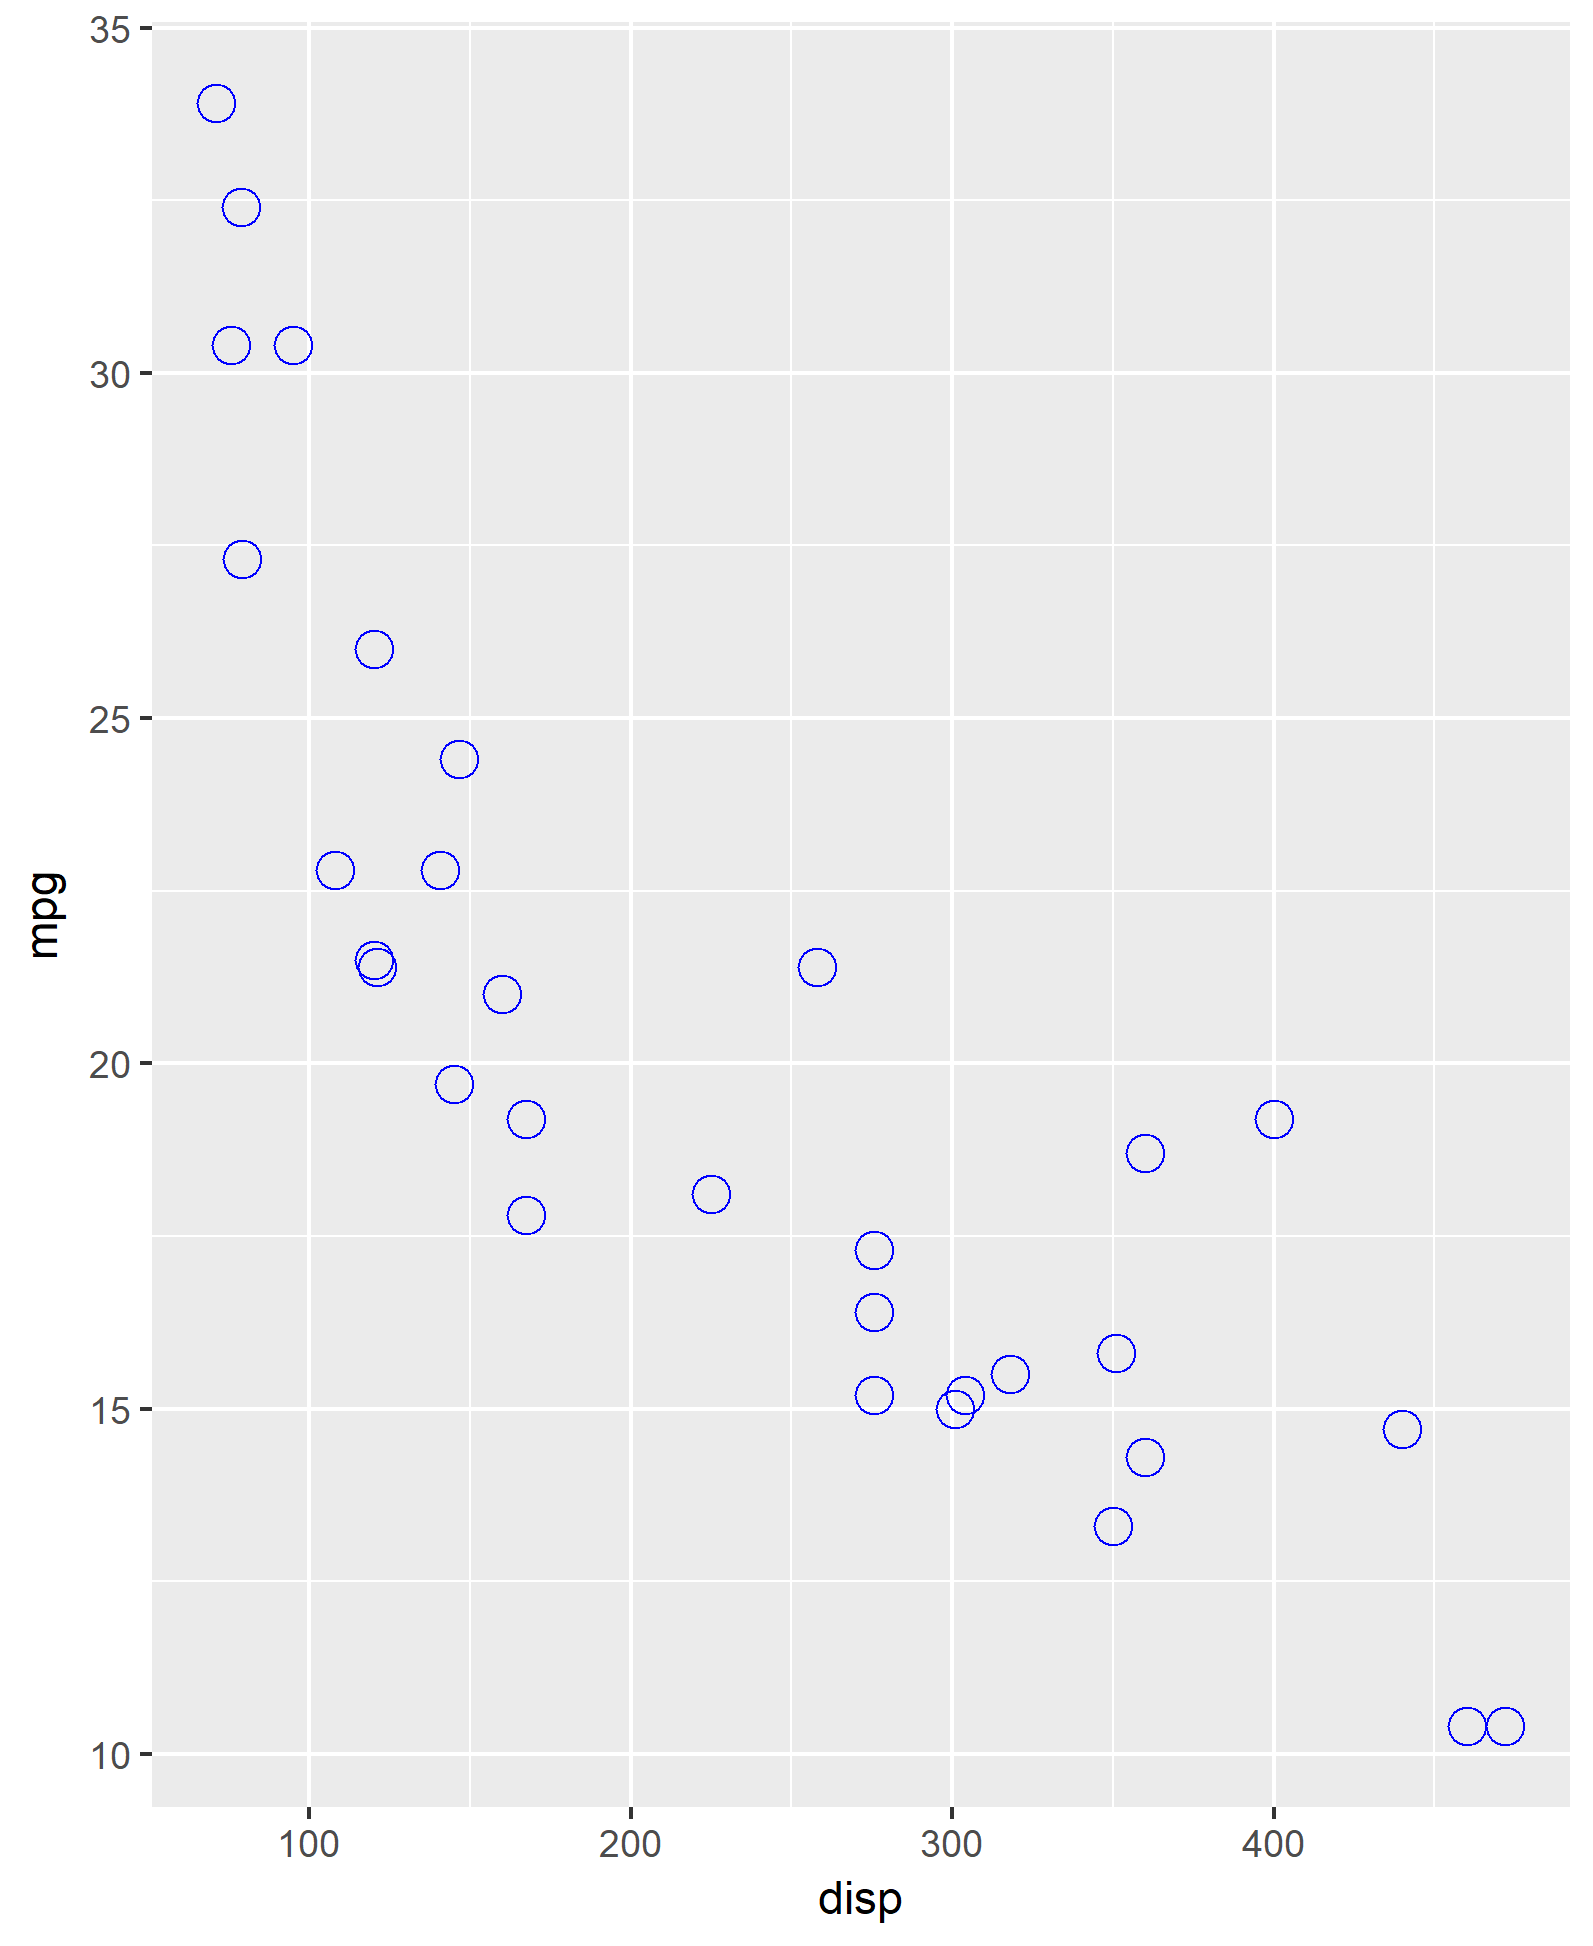
What is the fuel efficiency (mpg) for a given engine size (disp)?
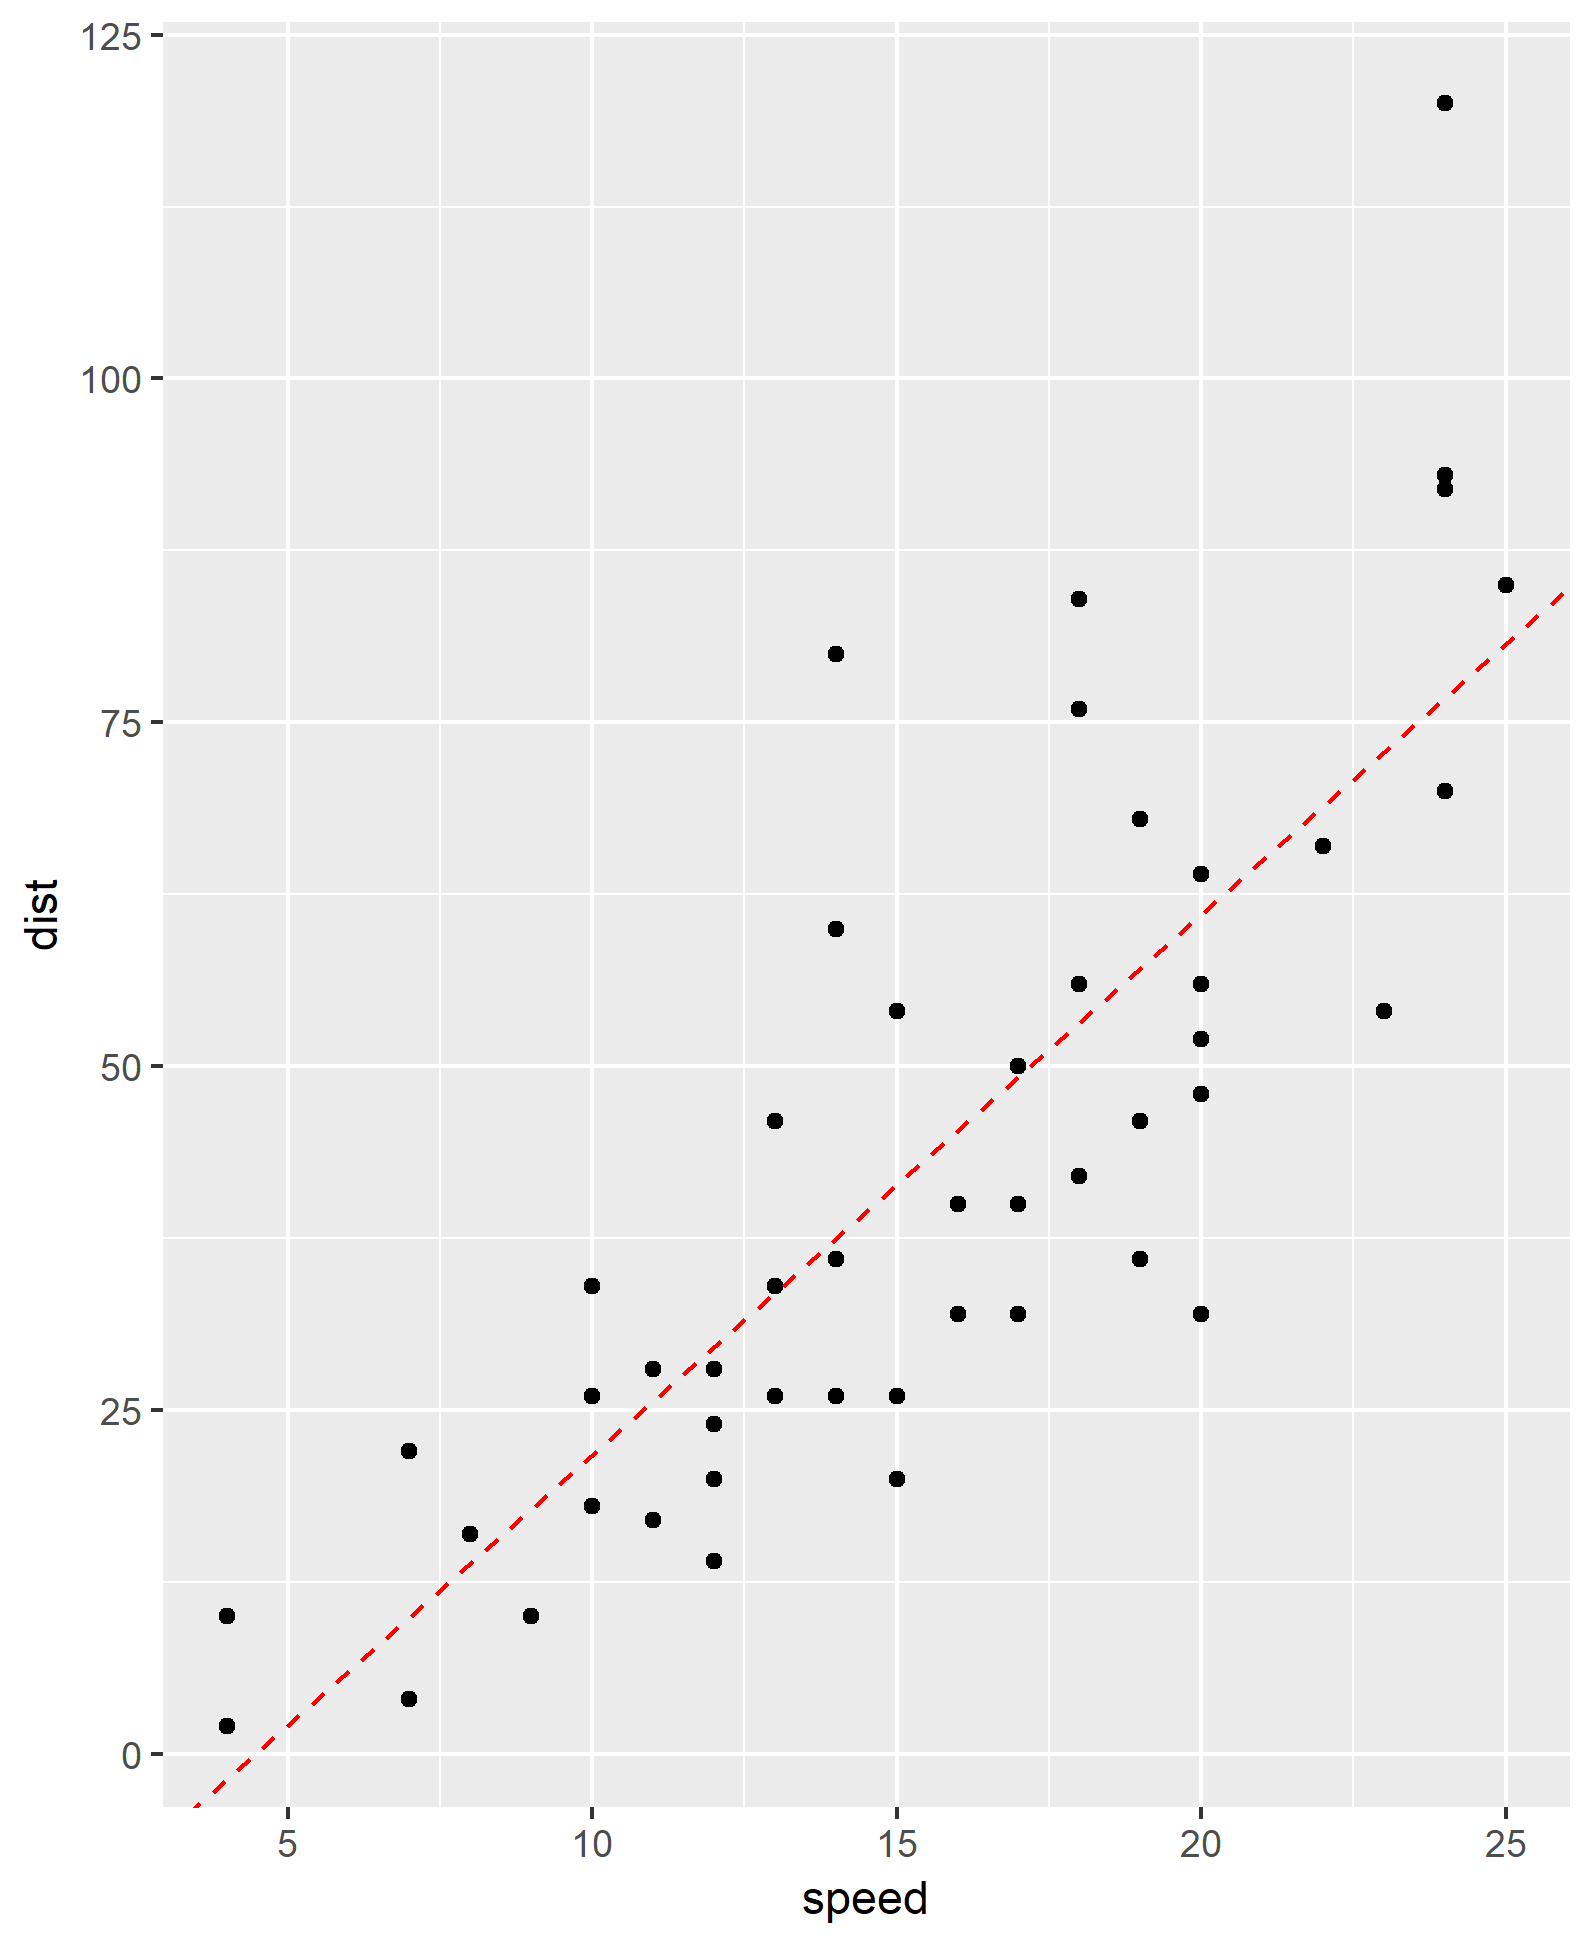
Example Algorithm: linear regression
Algorithm: dist = a speed + b
Model parameters: a = 3.9 , b = -17.6 Model formula: dist = 3.9 speed -17.6 Best fit line: overall, minimize the “difference” over all points of estimated and actual profit, finds a and b
Prediction
What is the stopping distance for a speed of 20?
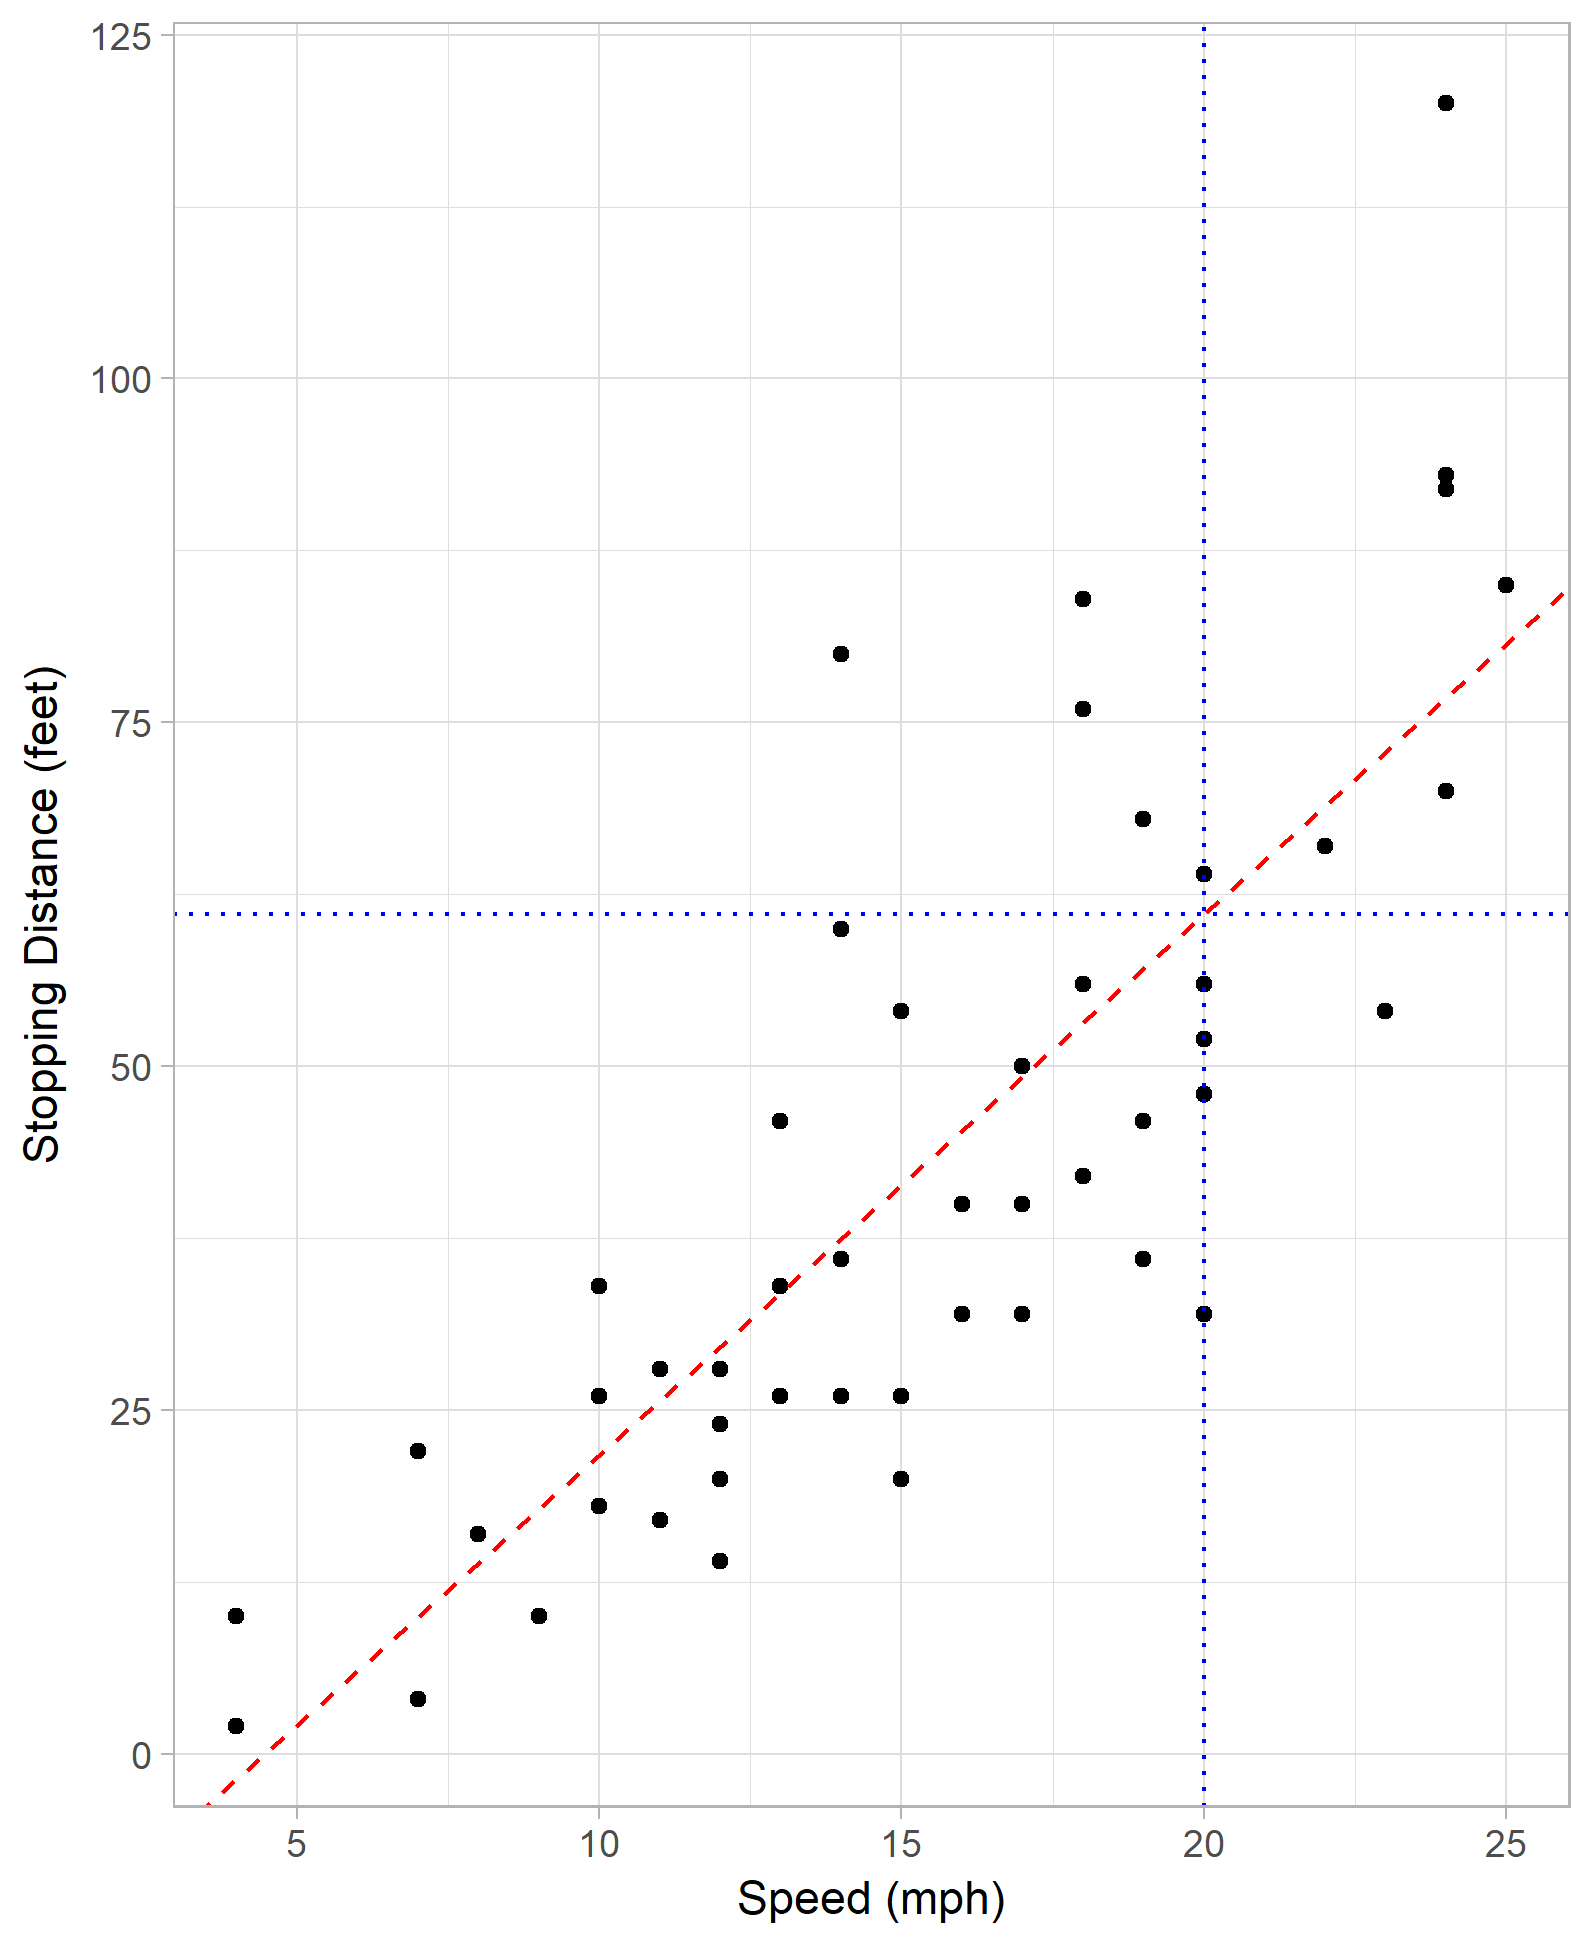
How good is our model?
- The p value: the probability that that there no relationship between dist (x) and speed (y)?
- The smaller the p value, the better the model
- Conventional threshold: p < 0.05 => significance
- Each term has its own p-value

Let’s get more real
- Profit depends on spend, also GDP growth, inflation, FX rates,…
- Stopping distance depends on speed, also weight, type of car,…
dist = a speed + b weight + … + c

Classification Example – Titanic Passenger List
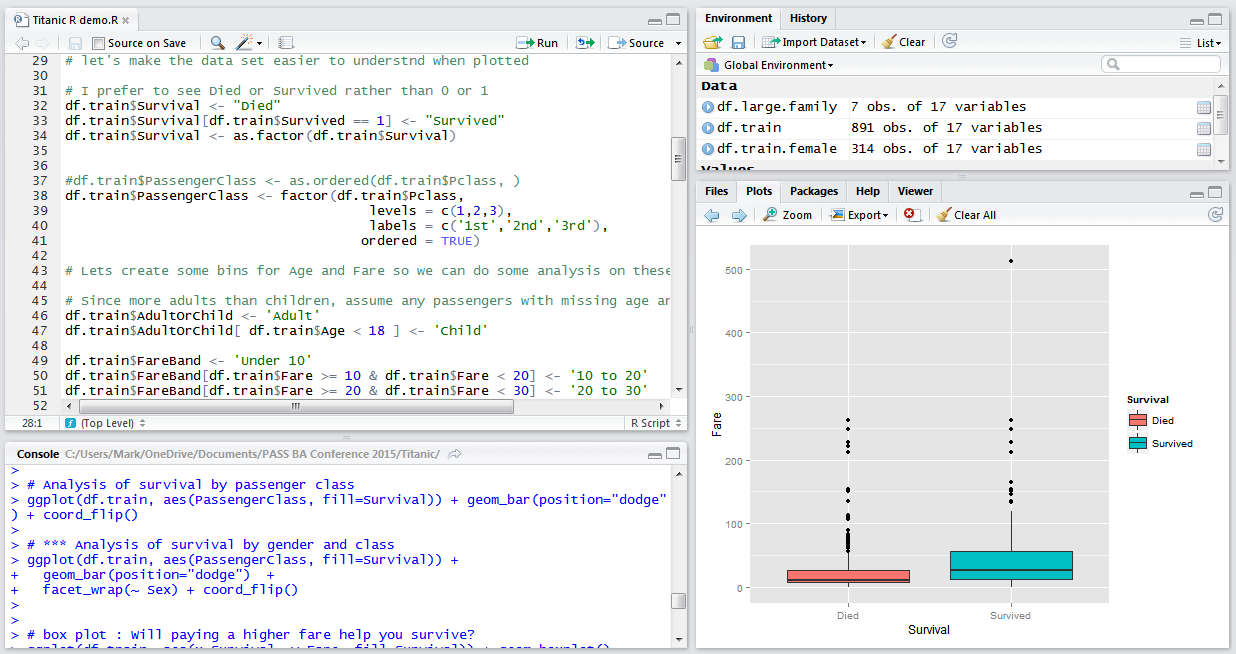
R & ggplot2 in Action
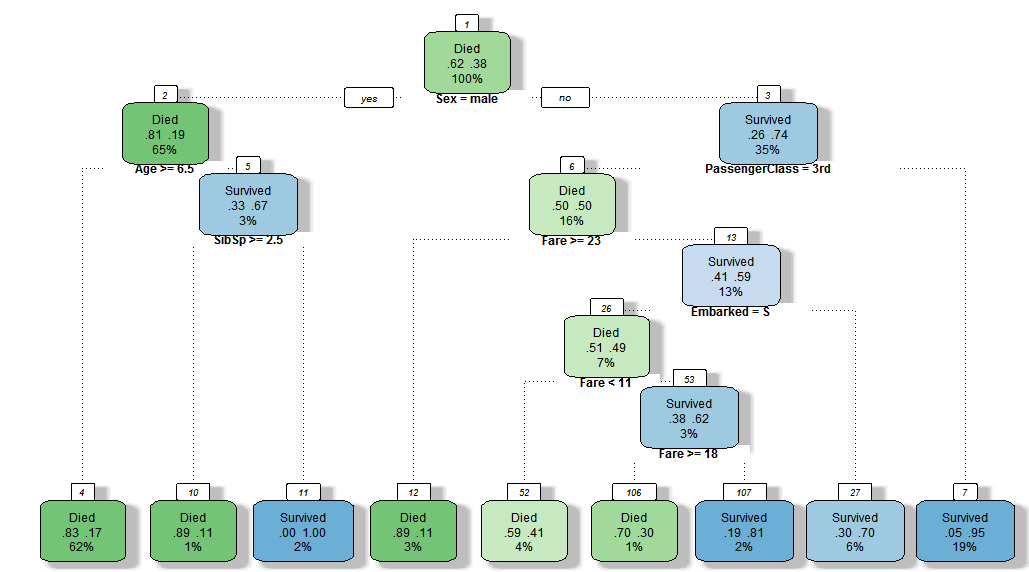
Predicting Titanic passenger survival - decision tree
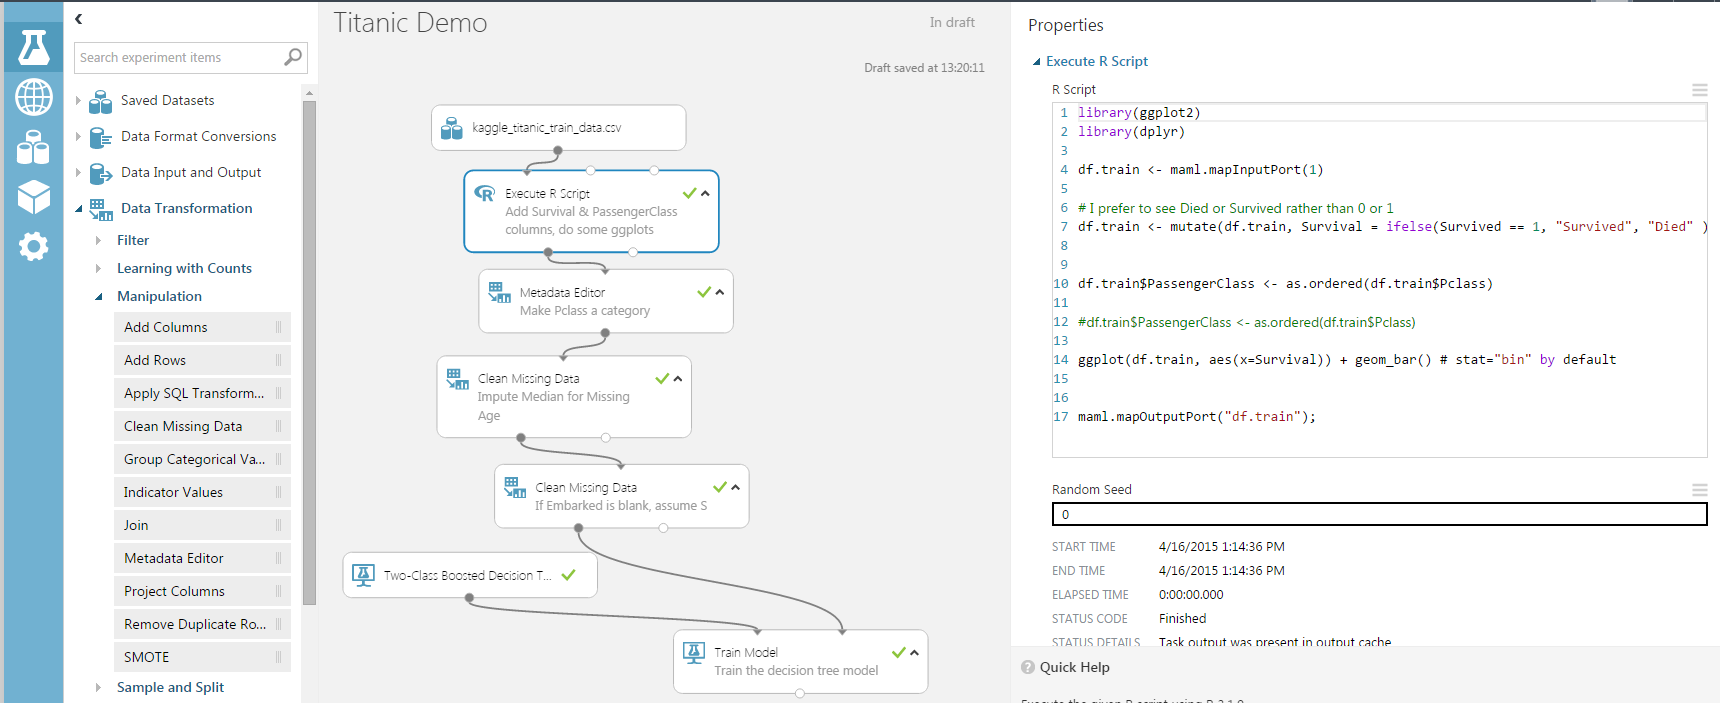
Predicting Titanic passenger survival - model builder tool
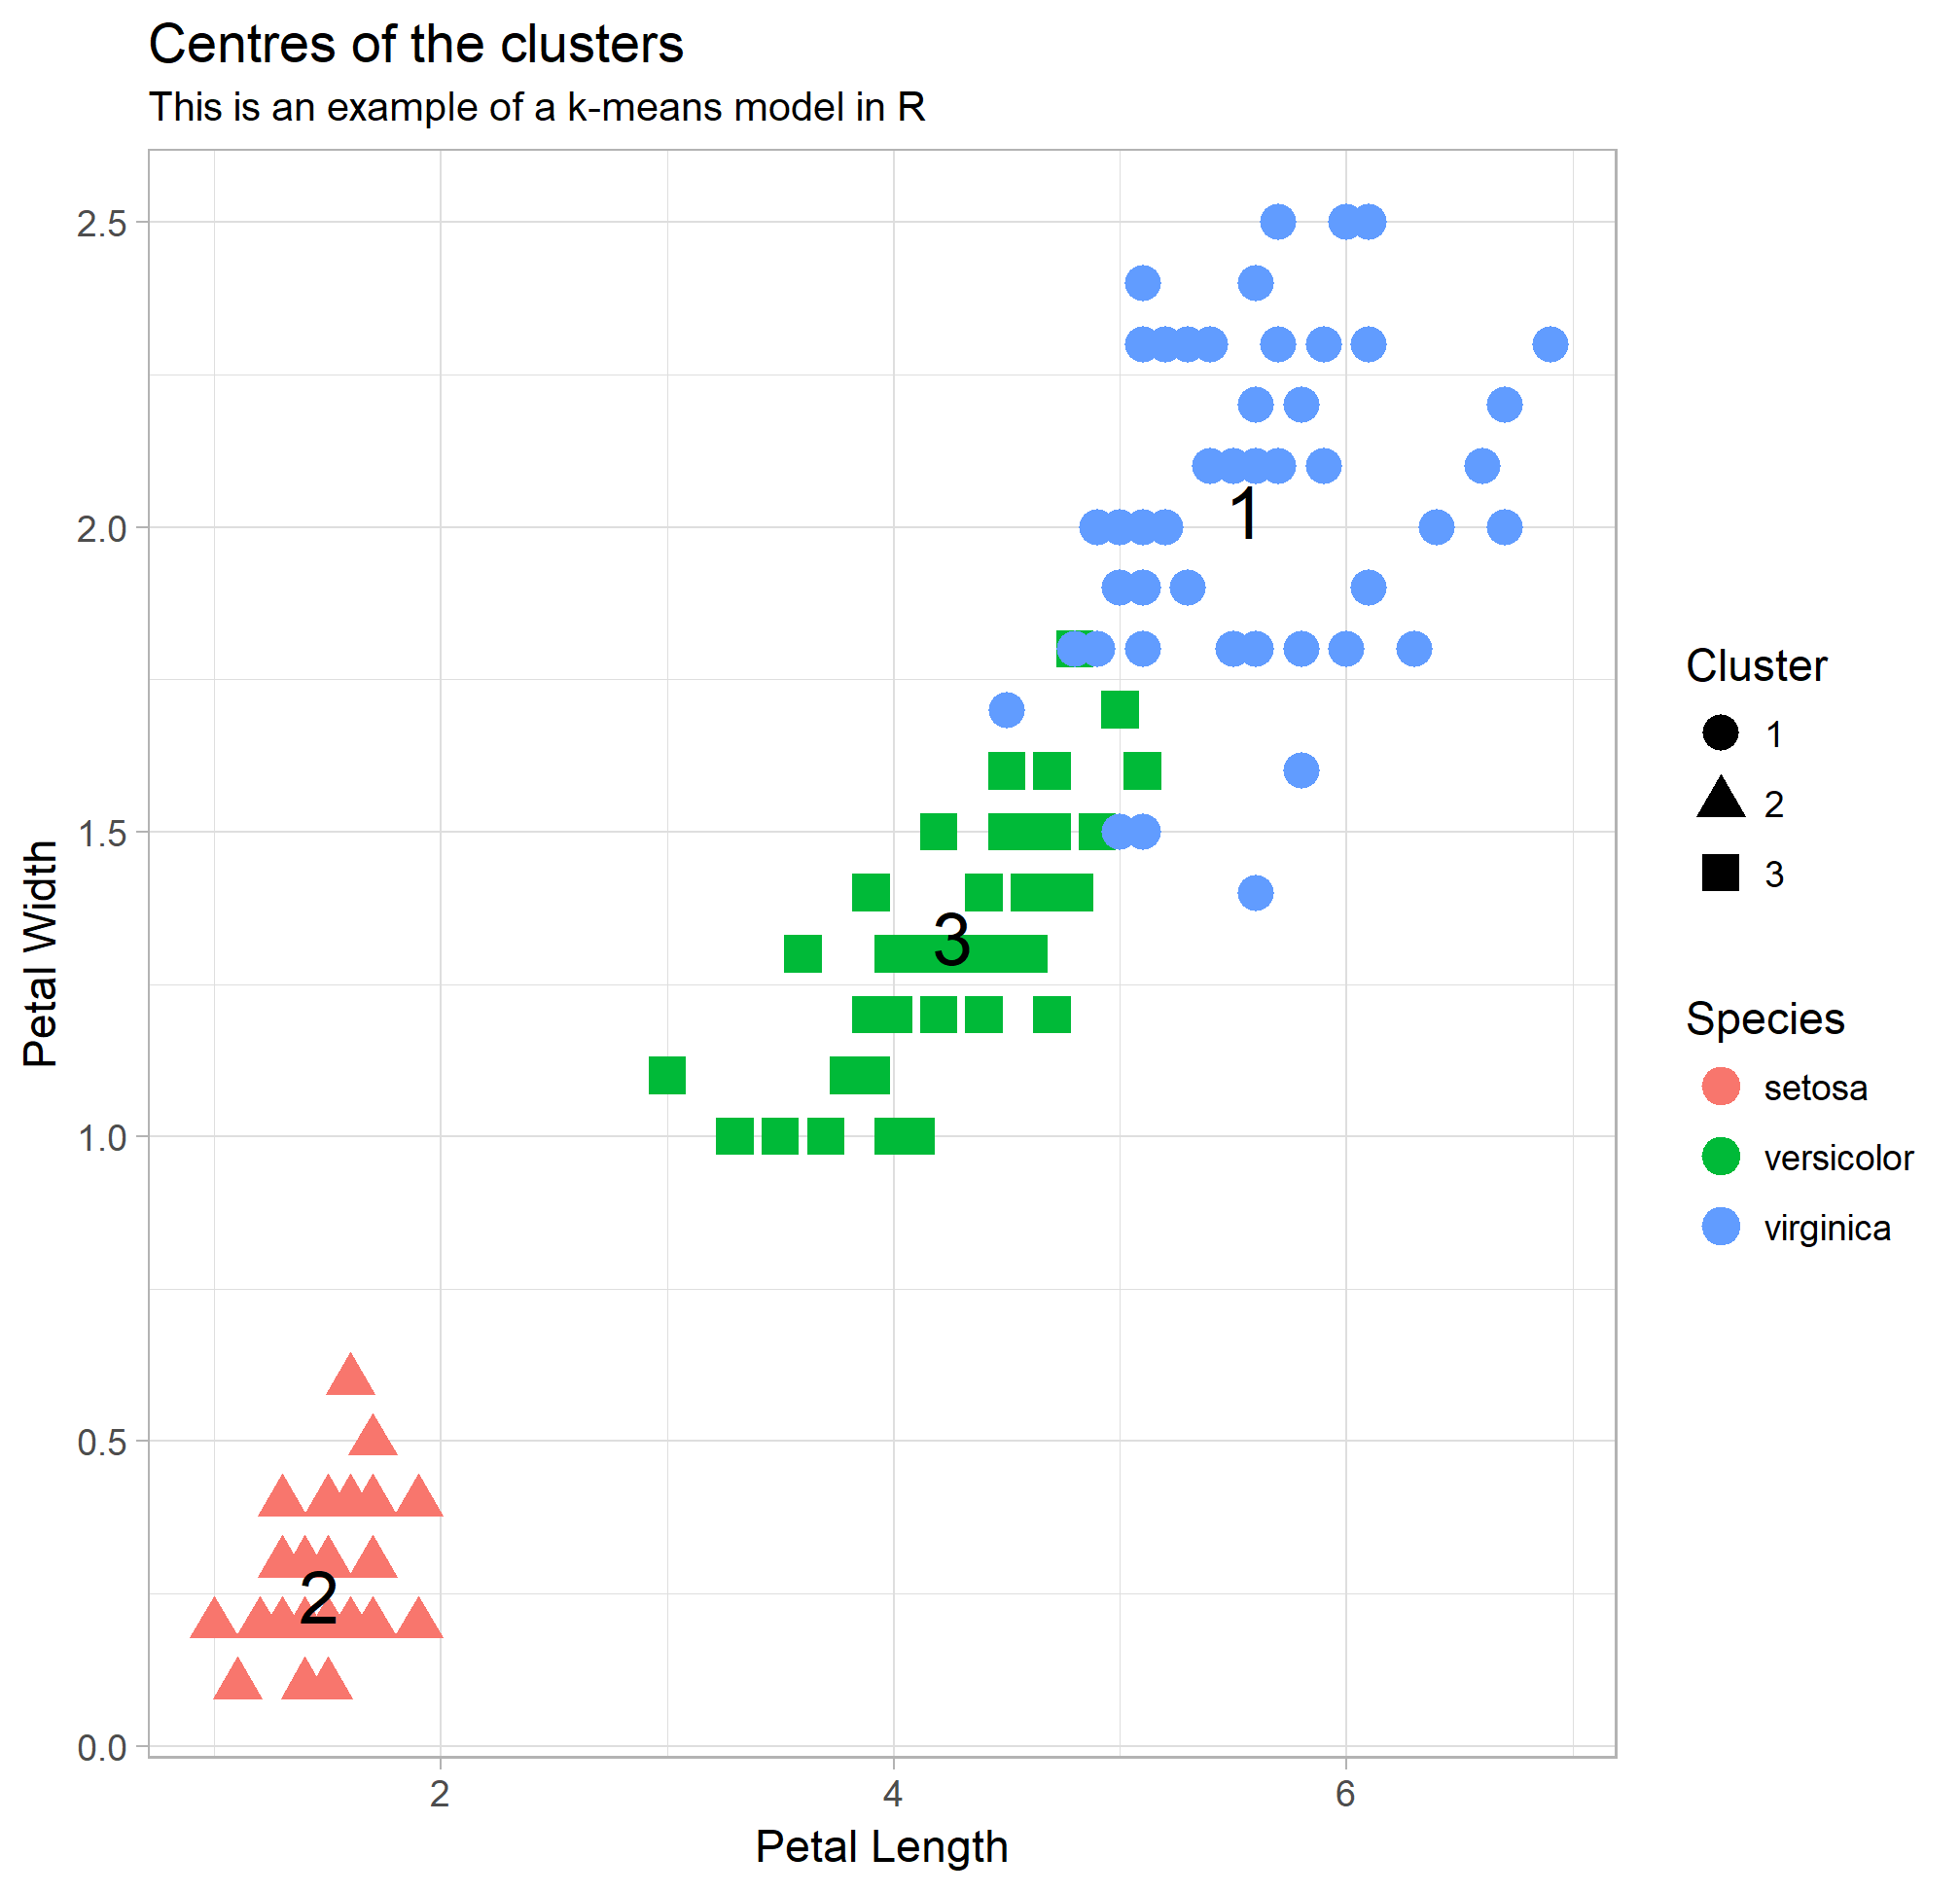
Clustering Example – Iris species
