Data and AI Training
Home | Prices | Contact Us | Courses: Power BI - Excel - Python - SQL - Generative AI - Visualising Data - Analysing Data
Data Modelling Course Notes
Data Modelling is about organising our data to encourage effective analysis, appealing and intuitive visuals and powerful calculations?
Data Modeling, sometimes called dimensional modelling :
- is a completely accepted approach
- is long established – it was introduced in the 1990’s (Kimball / Inmon)
- has standard, clear text book methods, definitions, terms. There is no need to re-invert the wheel.
- has many excellent learning resources available
A good data model underpins the success of our Power BI project. It helps us to:
- build better dashboards
- write simpler and more correct DAX calculations
- and we are less likely to hit a brick wall
Power BI stores data in a structured manner. All data exists within a table. Tables have rows and columns.
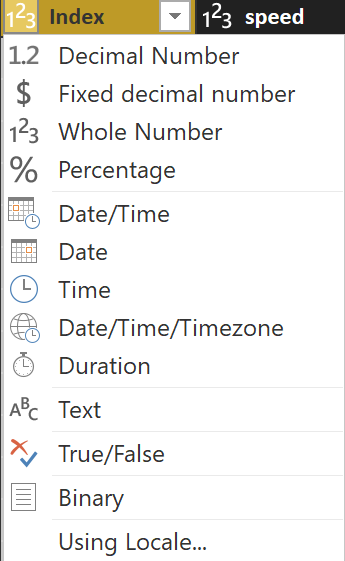
Power BI Specific Data Types
All columns have a data type such as
- string (max size)
- date / time (or both)
- number (whole number or decimal)
- boolean (True / False) The data types constrain the values that can be entered. This is useful: for example, we can be sure we can do date operations (e.g. get the date at the end of the month) on date columns
Power BI allows us to set the data type of a column.
Columns – summarization, format, category
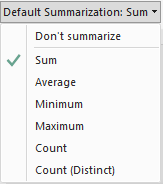
Power BI allows us to indicate how we would like the column values to be summarised (aggregated) by default when placed on a visual.
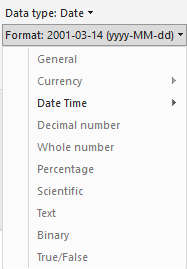
Formats
Power BI allows us to create a default format for some columns to control how it is diplayed in visuals. For example, we can set the format of a date column to a dd-mmm-yyyy format e.g. 16-Sep-2024.
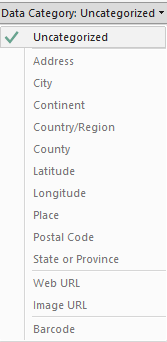
Data Categories
Power BI also allows us to set the category of the column. This is occasionally useful for geographic columns, as it suggests to Power BI know what to do with the column e.g. put it on an axis rather than a value.
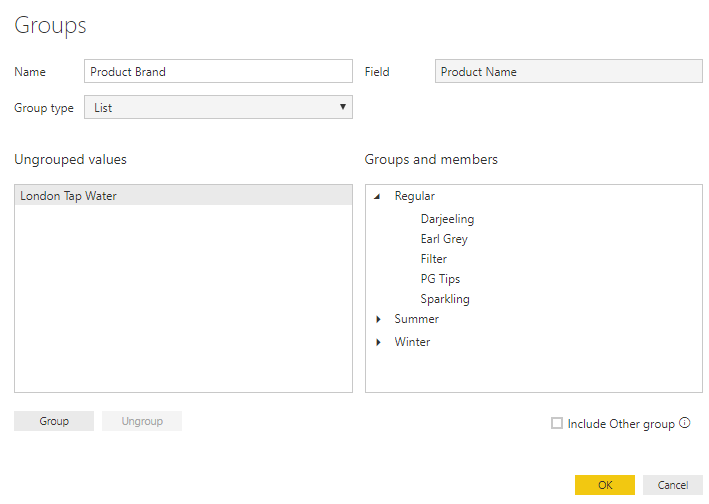
Creating new columns in Power BI
Power BI can create a new column based on the values of an existing column in two ways.
If the values are categorical text, it is best to group them (in effect, creating a broader level in a hierarchy)
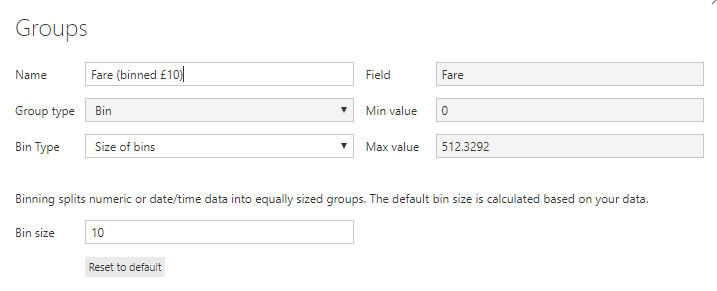
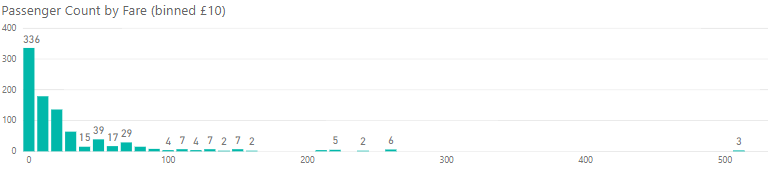
Bin continuous columns
If the values are continuous numeric values, it is best to bin them into bands.
Power BI Data Models
Relationships between tables
- A relationship between two tables is defined by a column on each
- Columns in each table have the same domain of values
- Nearly always “one to many”
- The one side has the primary key (PK) column
- The many side has the foreign key (FK) column
- PK must be unique and have no missing values
- Power BI understands the relationship – we can creat a chart with columns from several related tables without the need for VLOOKUPs or similar functions,
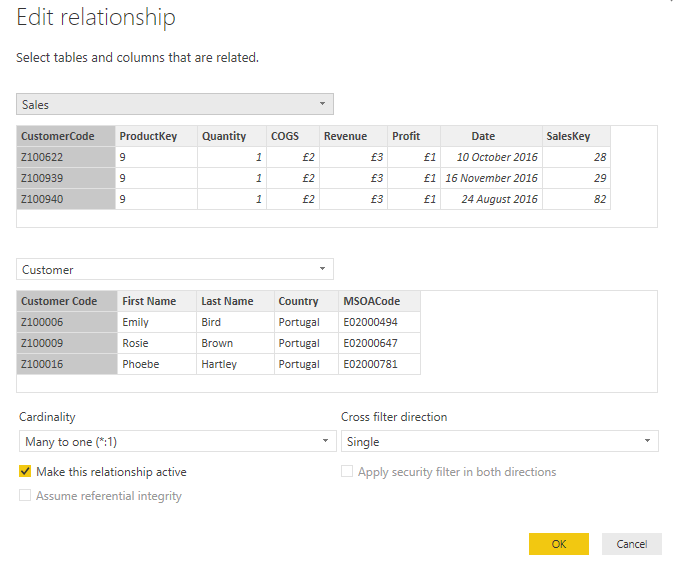
Power BI Edit Relationship Dialog
Tables Joined in Power BI Model View
Facts and Dimensions
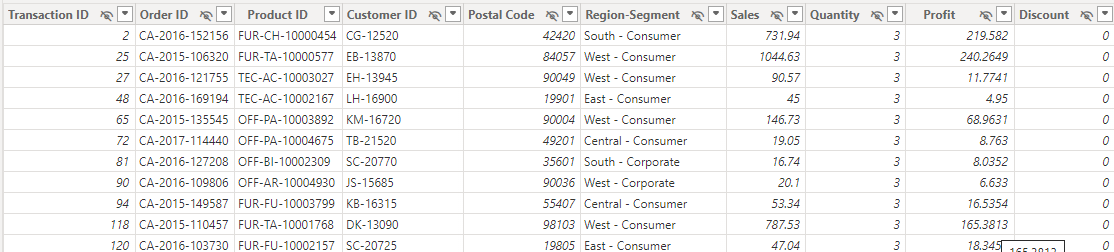
Facts
Fact tables represent events e.g. transactions or snapshots (e.g. inventory balance at end of month).
They always have a date/time element.
They contain the values / quantities.
They are long (lots of rows) and thin (few columns).
They are usually at the “many” end of a relationship. The columns are either
- foreign keys of dimension table (Dates are a FK into the special Calendar dimension table)
- quantities
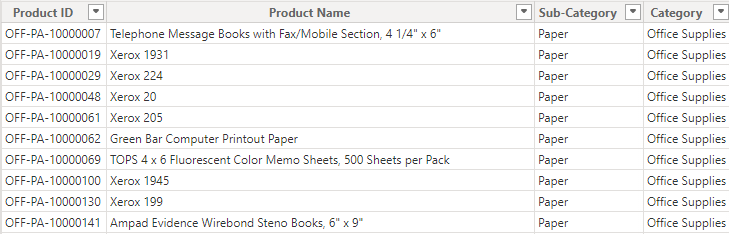
Dimensions
Dimension tables contain the categories to groups / sort / filter by
These are short (few rows) and fat (many descriptive columns).
They are usually at the “one” end of a relationship.
A dimension must have a unique column, a.k.a. Primary Key – this column forms the relationship with the fact table
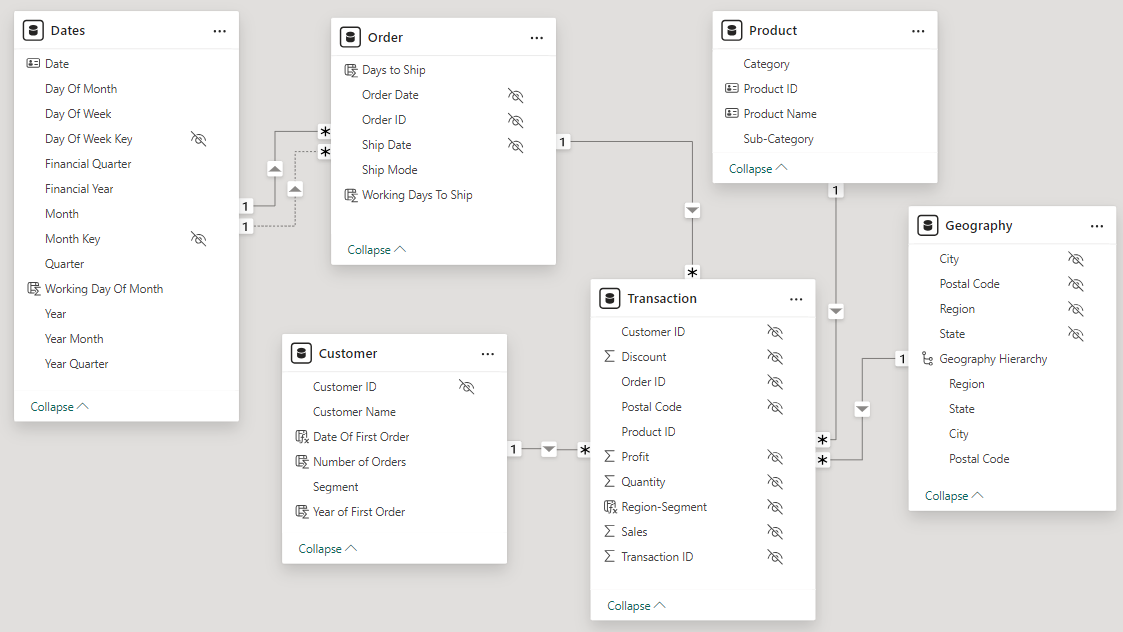
Star Schema vs Snowflake Schema Pattern
In a star schema every dimension table is directly joined to the fact table.
In this example of a star schema, the four dimension tables are directly connected to the fact table.
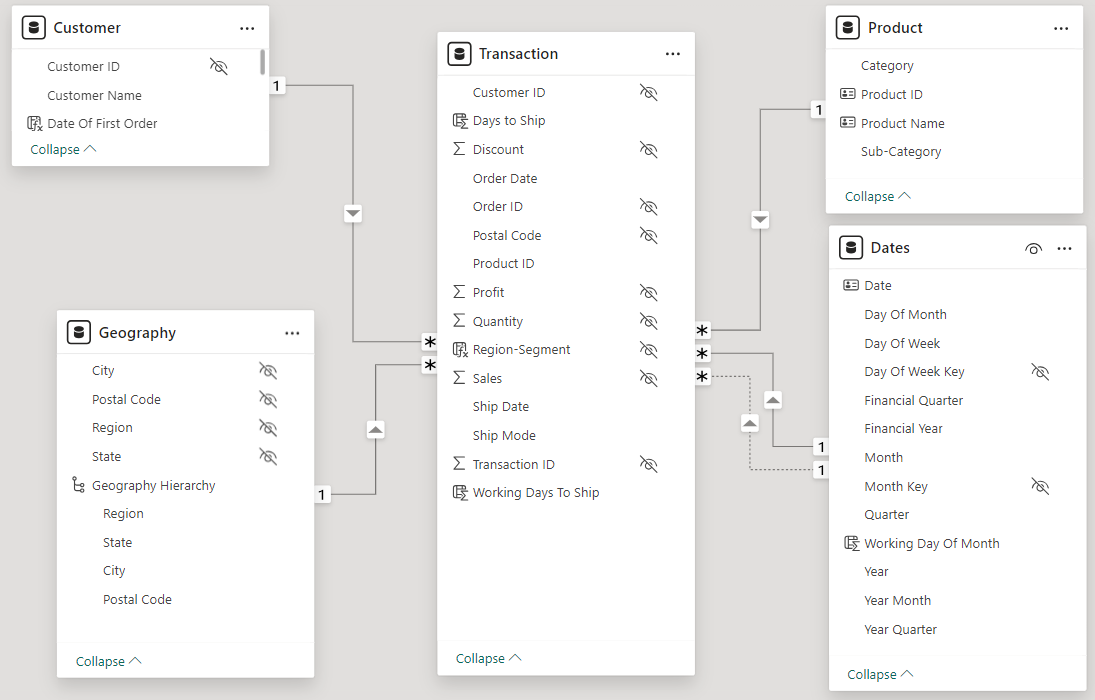
In a snowflake schema, some dimension tables are joined to another dimension table.
In this example of a snowflake schema, the Date tables is not directly connected to the fact table.
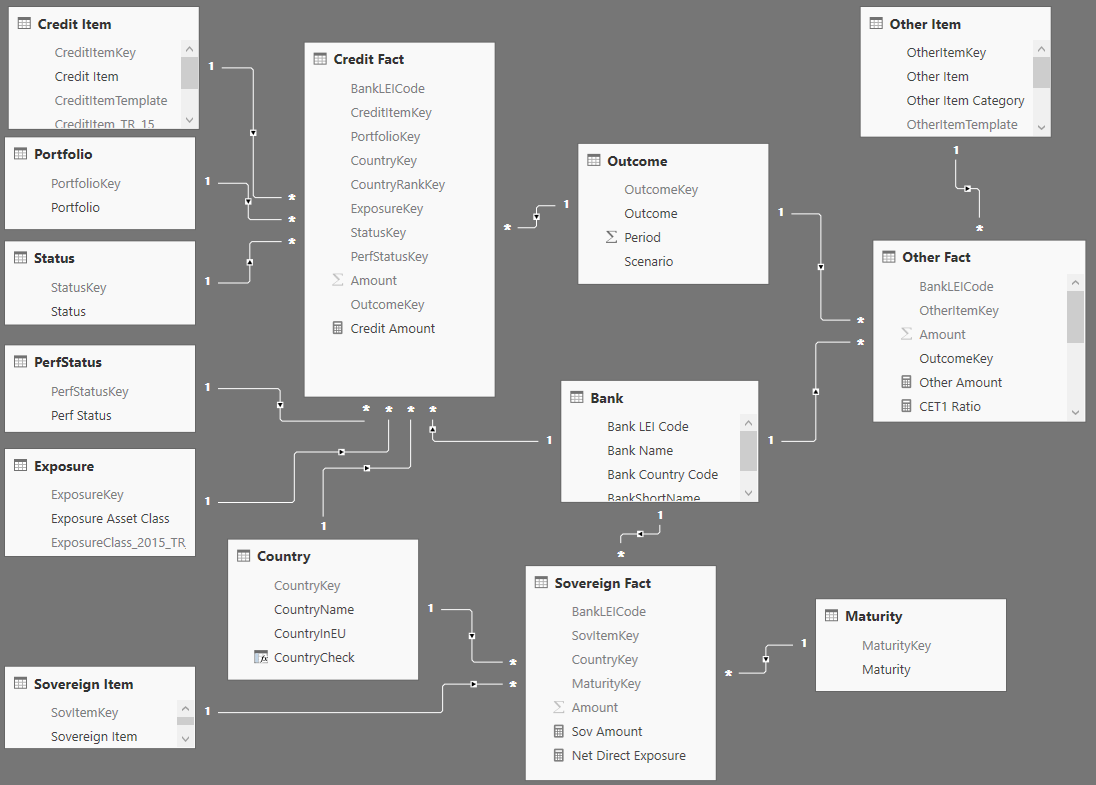
A more complated example if a snowflake schema - European Business Authority Stress Test Results Dataset
Ideally we should prefer star to snowflake schema patterns. Star schema results in simpler measures and have better performance.
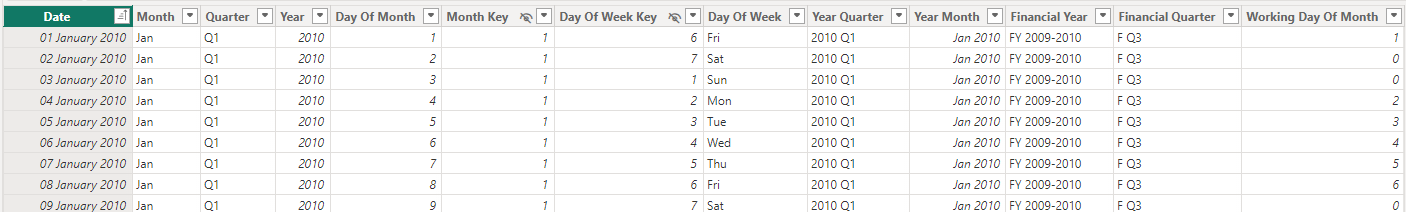
Date Tables
If you have dates, you need a date table
- A date table has a row for all dates in the period. No gaps!
- Columns typically include day of month, day of week, calendar month / quarter /year and possibly financial month / quarter /year. It may alsoinclude columns for organisation specific dates - e.g. bank holidays….
- Data tables are essential. We use (everywhere) for aggregating by period, time-intelligence e.g year-to-date
Hint: Consider investing in building an organsiation-wide date table. A date table is central and used everywhere. Organisations often have specific calendars. Implement either in Excel table, SQL or even DAX.
Role Playing Dimensions
Same dimension tables can be related to several columns in a fact table.
There can be only one active relationship between a pair of tables – other relationships must be inactive.
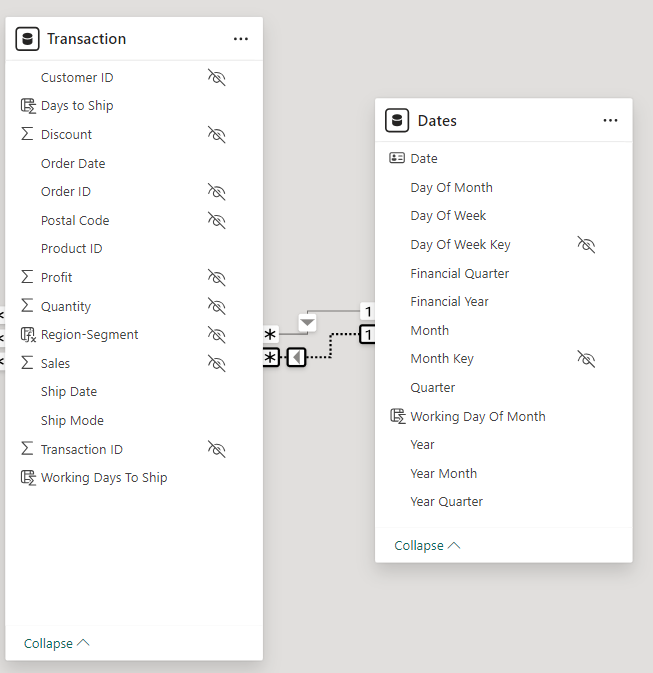
Use USERELATIONSHIP() and inactive relationships to create measures.
Sales By Ship Date =
-- By the date shipped rather than the date ordered
CALCULATE(
    [Sales],
    -- This overrides the  active relationship between 'Order'[Order Date] and Dates[Date]
    USERELATIONSHIP(
        'Transaction'[Ship Date],
        Dates[Date]
    )
)
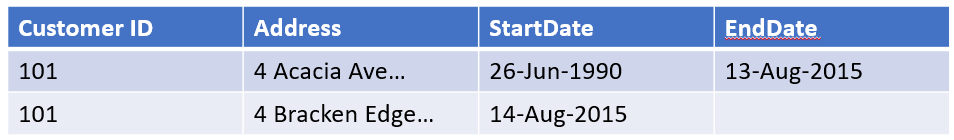
Slowly Changing Dimensions (SCDs)
Attributes Change: we can either
- Overwrite the history – type 1 SCD. Examples: change of a customer address
- Preserve History – type 2 SCD. Use 2 new columns StartDate and EndDate and a record for each version.
Good practice in building Power BI data models
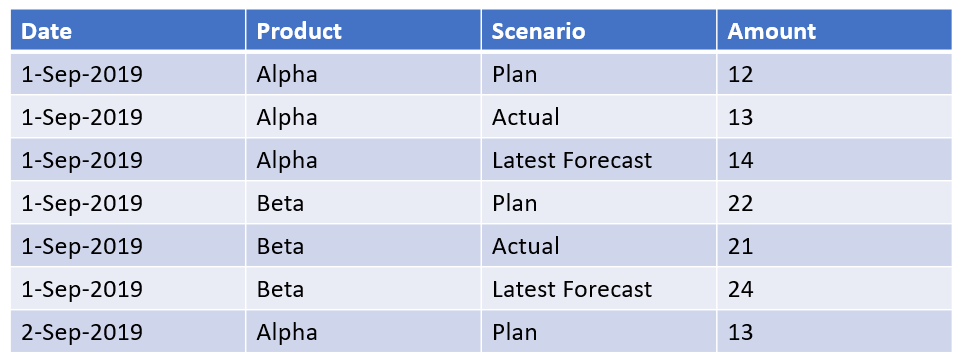
Prefer Long Format to Wide Format for fact tables
Often source data is in wide format
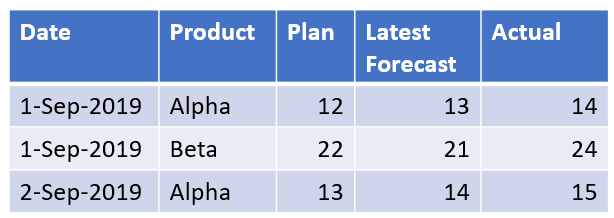
It is better to reshape it as long format (which is the format for tidy data)
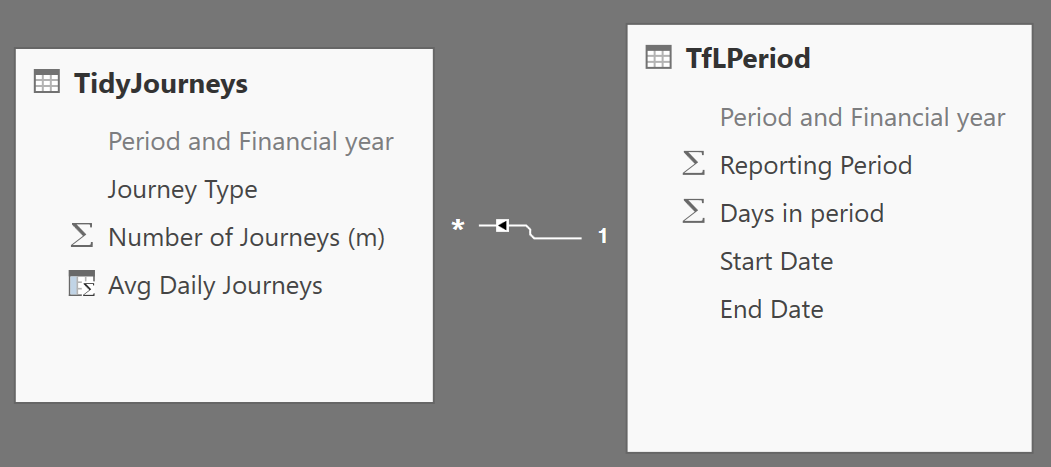
Take care with 1-1 relationships
If you see a 1-1 relationship, ask if the two tables should be merged.
1-1 relationships always have bi-directional filtering.
Take care with many-many relationships
Power BI will let you create a many to many relationships (after giving you a warning).
Better to model with a bridge table and 1 – many relationships.
Tidy up your data model (to help the user)
- Hide all surrogate columns
- Delete any columns you don’t need
- Hide the column on the many side of a join (you don’t need both)
- Put measures in the most appropriate home table (and possibly create a Measures table for those measures that do not have a natural home table)
- Use Display Folders to organise your measures
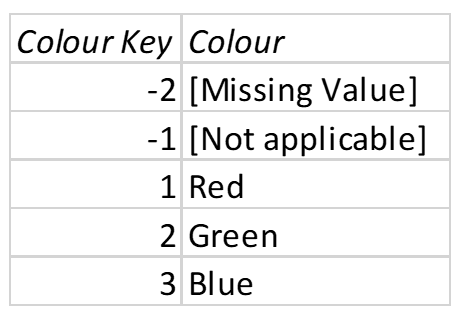
Deal with missing values in dimensions
- Don’t leave missing values as (blank)
- Use a special set of surrogate values
- Do you need to distinguish between missing and not applicable?
- Consider why your missing values are missing
Consider performance
Power BI cached data is all in memory – don’t run out.
Vertipaq engine is a column data sore
Columns are compressed in memory – up to 10x
Use Vertipaq Analyser Excel file to see what’s taking the memory.
Tips to improve performaance
Remove columns you don’t need. Especially high cardinality ones
Reduce cardinality e.g. Split date time into separate date and time columns?