Data and AI Training
Home | Prices | Contact Us | Courses: Power BI - Excel - Python - SQL - Generative AI - Visualising Data - Analysing Data
DAX Course Notes
These course notes accompany the DAX content in the intermediate and advanced Power BI courses.
DAX
DAX is a language for data modelling and calculation used with Power BI
We write DAX using the DAX Query View typically following these steps:
- Visualise the base data
- Write a DAX measure – baby step by baby step
- See the results from an EVALUATE SUMMARIZECOLUMNS()… in the DAX Query View
- Add the DAX calculations to the model
- View the DAX measure in a visualisation
- Explain the (often surprising) results
- Embrace problems and error messages if they occur. They will teach us something valuable!
DAX Outputs
DAX can create four types of output:
- measures,
- visual calculations,
- calculated columns,
- tables The first two are the most important.
Calculated Measures
- Created on the fly when page refresh, slicer change….
- Calculated for each mark on a visual
- Typically apply to aggregations over several rows
- Not Visible in Data View
- Dynamic
Visual Calculations
- *defined on a specific visual.
- can refer only to fields on the visual.
- executed in the scope of the visual.
Visual Calculations are described in detail in a separate section here.
Calculated Tables
- Created at data refresh time
- Either stand-alone or intermediate variable in a measure
Calculated Columns
- Created at data refresh time
- Part of the physical model
- One value per row
- Understand row context
- Visible in Data View
When to use a DAX calculated column
- When you need to slice (put on axis or legend)
- Use when need to group a continuous range - e.g. put on axis of bar chart. A measure cannot do this
- When creating a calculated table
- Move columns in a snowflake schema to make simpler field list
Date Of First Order =
/*
Returns  the date when the customer first made an order
Note that this is a calculated column - runs in row context looping thorough all Customer rows
SUMMARIZE returns  dynamic table of the number of transactions by order date for the current customer
MINX then retrieves the earliest date in this table.
*/
MINX(
    SUMMARIZE(
        RELATEDTABLE('Transaction'),
        'Transaction'[Order Date],
        "count", countrows('Transaction')
    ),
    [Order Date]
)
Variables
Use variables to improve readability, performance.
Split a complicated DAX expression into simple steps
Number of Customers In Band =
VAR selectedStart = SELECTEDVALUE('Sales Bin Thresholds'[Start])
VAR selectedEnd = SELECTEDVALUE('Sales Bin Thresholds'[End])
RETURN
CALCULATE(
    [Number of Customers],
    FILTER(
        'Customer',
        [Sales] >= selectedStart &&
        [Sales] < selectedEnd
    )
)
Implicit Measures and Explicit measures.
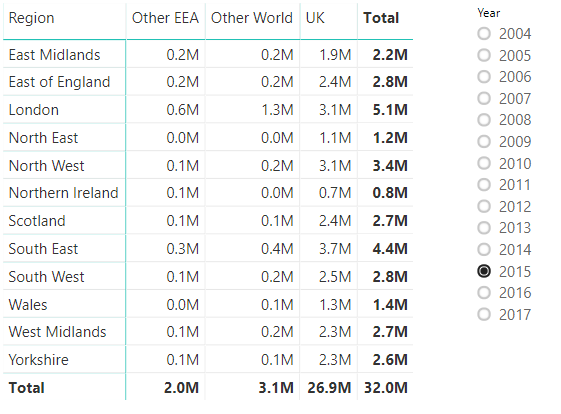
If we place a numeric field on the Values well of a visual, Power BI will, under the covers, automatically create an implicit measure.
<img src= “images/dax-visual-with-implicit-measure.png”alt=”dax visual w implicit measure” width=”600”>
We can see this if we launch the Performance Inspector, refresh such a visual, and then run the query in DAX query view
<img src= “images/dax-visual-with-implicit-measure-perf-analyser.png”alt=”dax visual w implicit measure per analyse” width=”600”>
The resulting DAX contains the implict measure CALCULATE(SUM('Transaction'[Sales]))
DEFINE
 VAR __DS0Core =
  SUMMARIZECOLUMNS('Customer'[Segment], "SumSales", CALCULATE(SUM('Transaction'[Sales])))

 VAR __DS0PrimaryWindowed =
  TOPN(1001, __DS0Core, [SumSales], 0, 'Customer'[Segment], 1)

EVALUATE
 __DS0PrimaryWindowed

ORDER BY
 [SumSales] DESC, 'Customer'[Segment]
It is very good practice to hide numeric field and create an explicit measure.
DEFINE MEASURE 'Calculations'[Sales] = SUM('Transaction'[Sales])
EVALUATE
    SUMMARIZECOLUMNS(
  Customer[Segment],
        "Sales", 'Calculations'[Sales]
    )
This means that subsequent DAX formulas are simpler, for example:
DEFINE MEASURE 'Calculations'[COGS] = [Sales] - [Profit]
Explicit measures helpful if measure does not useful default aggregation, for example:
DEFINE MEASURE 'Calculations'[Shortest Lifespan] = MIN(‘HealthData’[Lifespan])
In fact, creating explicit visuals is almost mandatory. Fileds parameters don’t work with implicit measures. Calculations groups set the model to ‘discourage impicit measures’.
Aggregator Functions
Examples of aggregator functions are SUM(), AVERAGE(), MIN(), MAX()
Aggregator functions take a column e.g. SUM (
Iterator (X) functions
Examples of iterator functions are SUMX(), MINX(), RANKX() and FILTER().
Iterator Functions loop through a table, calculate an expression then aggregate the result.
Example: SUMX (<table>, <expr>)
Last Week Total = SUMX(Gutenberg, Gutenberg[LastWeek])
The expression can be a column, a RELATED() column or, for example, a multiplication of two columns
Retail Price =
SUMX(
    Sales,
    Sales[Quantity] * Sales[Unit Price]
)
Full Price =
SUMX(
    Sales,
    Sales[Quantity] * RELATED(Product[Price])
)
The FILTER function is a very useful iterator
FILTER(table, filter_condition) returns a table
- table is any table, either physical or virtual, resulting from a table function like ALL()
- filter_condition is a boolean test applied to every row of the table
The output is a table with those only rows passing the test (could be 0, 1, several rows).
Example
DEFINE
    MEASURE 'Calculations'[Furniture Sales Values] = CALCULATE(
    [Sales],
    FILTER(
        VALUES('Product'[Category]),
        -- VALUES() returns a table of the distinct values, respecting any filter context
        'Product'[Category] = "Furniture"
    )
)
Filter Context
Implicit filter context is applied to a measure by filters from the visuals on the page. This could be from the visual that shows the measure (for example, filters applied by axis or legend) or by other filters on the page such as a slicer, or filters applied by the filter pane
Filter Context Rules
- A filter context has several filter rules. Each filter rule is a boolean (true/false) test applied to each a row
- Every measure in visualisation starts with all rows available then filter rules are applied one after the other to reduce the rows (cumulative filter effect)
- Implicit filter context arises from other fields in same visual or other visuals e.g. slicers
- Explicit filter context arise from our DAX code (discussed later)
- Explicit filter context is applied after implicit filter context.
Example
In the snapshot below, the measure defined as:
Number of Jobs = sum(Table[_Number of Jobs])
Question) Each mark on a viz has a different value but all marks use same DAX formula so how are they different?
Answer) Each mark is implicitly filtered by the axes of the visual (e.g. axis in bar chart, row & column headers on matrix) and by external slicers
Row Context
Row context applies in the
- definition of a calculated column,
- loop expression of an iterator function
Example: a calculated column of a table.
Both Weeks = Gutenberg[LastWeek] + Gutenberg[ThisWeek]
Example: within an iterator function
Weekly Increase =
SUMX(
    Gutenberg,
    Gutenberg[ThisWeek] - Gutenberg[LastWeek]  -- this expression is executed in a row context
)
Note:
- Column names refer to values in the same row
- Row context ignores relationships.
- Aggregator functions ignore row context
Context and Filtering
Implicit filter: context (query context) provided by the visuals on the page
vs
Explicit filter: adding/ replacing filters with DAX code
We can modify implicit filter context using:
- CALCULATE() and CALCULATETABLE() functions
- ALL() and variations
CALCULATE() and CALCULATETABLE()
These are the only functions that modify the filter context.
CALCULATE (<expr>, <filter1>, <filter2>, ...)
Returns <expr> in the context modified by the filters
The Calculate Modifier
- FILTER () function
- REMOVEFILTERS(
) - ALL() or ALLSELECTED()
- USERELATIONSHIP() Filters are Tables
CALCULATE and FILTER pattern - example
Number of English Authors =
CALCULATE(
    COUNTROWS(Author),  -- the expression
    FILTER(
        -- ALL() returns a table required by FILTER()
        ALL(Author[Author Country]),
        -- The boolean uses the [Author Country] column -  in the table returned by ALL().
        Author[Author Country] = "England"
    )
)
CALCULATE and FILTER syntax sugar
We can write the previous measure using syntax sugar. Under the covers it expands to the previous definition
Number of English Authors (sugared) =
    CALCULATE(
        COUNTROWS(Author),
        Author[Author Country] = "England"
)
CALCULATE and REMOVEFILTERS()
REMOVEFILTERS() is a new calculate modifier which has a more meaningful name
Number of English Authors (sugared) =
    CALCULATE(
        COUNTROWS(Author),
        REMOVEFILTERS(Author[Author Country])
        FILTER(
            VALUES(Author[Author Country]),
            Author[Author Country] = "England")
)
Time Intelligence
Time intelligence is ubiquitous and important.
Use date (calendar) tables. Mark as a date table.
DAX has built time-intelligence functions e.g. TOTALYTD()
For more advanced cases e.g. moving average, we need to build from scratch
Handle several date columns in the same fact table with USERELATIONSHIP()
Common date functions include DATE(), DATEADD(), PARALLELPERIOD(),….
Appendix: Common DAX Functions
A brief look at the DAX functions that will be most useful in our exercises.
- DIVIDE, COUNTROWS
- IF, SWITCH
- CONCATENEX, FORMAT
- GENERATESERIES, CALENDAR, CALENDARAUTO
- ALL, VALUES
- HASONEVALUE, SELECTEDVALUE
- SELECTCOLUMNS, ADDCOLUMNS, SUMMARIZE
- RELATED, RELATEDTABLE
- UNION, DISTINCT, TOPN
COUNTROWS
Scalar Function
- Returns the number of rows in the table
- Always useful: the first measure to create on a table.
- An aggregator function
DIVIDE
Scalar Function
DIVIDE (<expr1>, <expr2>, <default>)
Divides expr1 by expr2
Safe divide: returns default if expr2 is zero
Returns BLANK () if default not specified
Useful for ratio calculations, e.g. percent of parent
CALENDAR
CALENDAR (<start_date>, <end_date>)
Generates a single column table of dates from <start_date> to <end_date> inclusive.
Useful for generating sample data
CALENDARAUTO() will generate a table of dates from the 1st of Jan of the year of the earliest date to the 31st December of the year of the latest date found in all the date columns in the model.
IF
Scalar Function
IF (boolean_expression, value_if_true, value_if_false)
Example:
DEFINE
   MEASURE 'Calculations'[Sales Year On Year Change %] = IF(
    ISBLANK([Sales This Year]) || ISBLANK([Sales Previous Year]),
    BLANK(),
    DIVIDE([Sales This Year] - [Sales Previous Year], [Sales Previous Year])
)
SWITCH
Scalar Function
SWITCH (<target_expr>, <expr1>, <result1>, <expr2>, <result2>, …)
Returns the first <resultN> where <exprN> matches <target_expr>
Typically use in a match first pattern
SWITCH (TRUE, <expr1>, <result1>, <expr2>, <result2>, <else>)
CONCATENEX
Scalar Function
CONCATENEX (<table[column]>)
Flattens the values in several rows of the column to a single text.
Useful in test/debug to show table content in a measure
ALL and VALUES
Table Function
ALL ignores any filter context
ALL (<table[column]>) returns a distinct set of values.
Useful in many functions, e.g. time-intelligence, ratios
VALUES Respects any filter context
VALUES (<table[column]>) Returns a one column table of the distinct set of values
HASONEVALUE and SELECTEDVALUE
Scalar Function
HASONEVALUE (<table[column]>)
Returns TRUE if (<table[column]>) has only one value, FALSE otherwise.
Often used with VALUES. For example:
IF(
    HASONEVALUE(VALUES(<table[column]>),
    VALUES(<table[column]>),
    “Select single value”)
Syntax sugar: SELECTEDVALUE (<table[column]>, default_value)
RELATED
Scalar Function
RELATED (<table[column]>)
Used to refer to a column where row context is being applied.
Necessary since row context does not propagate through relationships.
RELATED (<table>) is on the one side
RELATEDTABLE
Table Function
RELATEDTABLE (<table[column]>)
RELATEDTABLE(<table>) is on the many side
GENERATESERIES
Table Function
GENERATESERIES (start, end, step)
Generates a single column table of from start to end inclusive.
Useful for generating sample data.
Other useful functions
- UNION
- DISTINCT
- TOPN
(More) Table Functions
Summarising data using SUMMARIZE (), SUMMARIZECOLUMNS () and GROUPBY ()
Reasons for summarising data and examples use cases
Using SELECTCOLUMNS () and ADDCOLUMNS ()
Joining and generating data: CROSSJOIN (), GENERATE () with FILTER ()
SELECTCOLUMNS and ADDCOLUMNS
SELECTCOLUMNS (<table>, <column1>, <column2>,…)
returns a table with selected columns
ADDCOLUMNS (<table>, <name1>, <expr1>, <name2>, <expr2>,…)
Adds new columns to a table
Table functions: summarising data
Summarising data using SUMMARIZE (), SUMMARIZECOLUMNS () and GROUPBY ()
Reasons for summarising data
Performance tables
Double aggregations: max of sum, netting calculations
Example use case
Get the number of days between current and previous events
Joining and generating data
Using CROSSJOIN() for cartesian results
Using GENERATE() with FILTER() to achieve joins outside of the standard relationships
Example use-cases:
- Creating a result table with a row for every date in a period (defined by start-date and end-date columns)
- Two-column joins