Zomalex | Data and AI Training
Use Agentic AI and the Power BI Modeling MCP server to inspect and improve the model
In this exercise, we use an AI model and the Power BI Model Context Protocol (MCP) Server to directly improve a Power BI semantic model (tables, columns, measures, formats, relationships) with natural language instructions. We can issue our instructions either from Claude Desktop or from GitHub Copilot Chat within VSCode.
Get Started
If using a model in Power BI Desktop, the very first instruction should be
Connect to the open Power BI model.
If using a published model in a Fabric workspace, change the details (workspace name, model name, connection link) in the example prompts below. The connection link can be found in Workspace Settings - Connection Link
Connect to the published Superstore Power BI model at powerbi://api.powerbi.com/v1.0/myorg/Modern%20Data%20Model using the Power BI Modeling MCP server
or
Connect to the published Power BI model using the Power BI Modeling MCP server The workspace name is ‘Modern Data Model’. The model name is ‘Superstore’
Suggested Instructions to the AI Assistant
This is just a guide, feel free to adapt this and ask your own questions and give your own instructions.
Get started
Describe the semantic model.
List the tables in the model.
List the measures.
A good work flow for improving the model
- Review the semantic model.
Can you suggest any refactoring or changes to improve the model or to meet best practices? - Ask the AI to implement these one by one.
- Check the model before and after the change. This could be with
Write a DAX query to test...orList the formats of all measuresor manually to build a visual to check the results look as expected. Review the model in its current state and list 5 refactorings or improvements. Order them by most important first.
If using Power BI online, improve the draft Dates table
If using Power BI online, we imported a basic Dates table. We can ask the AI to make a few changes to create the fully featured dates table. For example,
Filter the Dates table to the years 2020 to 2024 inclusive.
In the Dates table, sort each column by its corresponding key column if there is one
In the Dates table, hide the key columns
(This is the date range of the two dates columns in the Orders table.)
Stretch task - Make this into a star schema model
One issue with the data is that the two date fields are on the Orders table, which is a dimension table. It is better to have dates in the fact (Transactions) table, as this results in a star schema pattern rather than a snowflake pattern.
Manual method
If we want to do this manually, these would be the steps. In the Query Editor
- merge the transaction and the order table so that the transaction table now contains the columns of the order table
- uncheck “Enable Load” for the order table so it is not loaded into the data model
Any relationship between the now removed Orders table and the Dates table will have been removed. Create two relationships:
- an active relationship between the Date column of the Dates table and the Order Date column of the Transaction table
- an inactive relationship between the Date column of the Dates table and the Ship Date column of the Transaction table
AI (Claude) method
If we want the AI to do this using the Power BI Modeling MCP server, use a prompt like this.
The model is a snowflake schema and would be better as a star schema. To achieve this, merge the Transactions and the Orders table on their Order ID columns so that Transactions contains the columns of the Orders table. You will need to remove the relationships with the Orders table before this and add relationships between the Dates and the Transactions table afterwards.
Resources - Example prompts
Applying best practices, based on examples in the official Power BI MCP Modeling GitHub page
Analyze the model’s naming conventions and suggest renames to ensure consistency
Add descriptions to all columns and tables to clearly explain their purpose
Add descriptions to all measures to explain their purpose and the DAX code in simple, understandable terms.
Analyze the Power Query code for all tables, identify the data source configuration, and create semantic model parameters to enable easy switching of the data source location. Generate a Markdown document (.md) that provides complete, professional documentation for a Power BI Semantic Model. Use a simple mermaid diagram to ilustrate the table relationships. Document each measure including the DAX code and a description of the business logic using business friendly names. Document the data sources by analyzing the Power Query code.
Some examples of very specific prompts
Create an empty table, Calculations, in the model to hold measures.
Add a measure, Sales, to calculate total sales.
Rename the table Transaction to Facts.
Create explicit measures for sales, profit, and quantity.
Hide the underlying columns of these new explicit measures.
Add a measure, Profit Margin.
Write a DAX query to test the Profit Margin measure. Show Profit Margin by Region.
Add a measure, Discounted Sales. Use the columns Fact table columns Discount and Sales.
Add a measure, Sales By Ship Date, that uses the inactive relationship with the Ship Date column.
Add other … By Ship Date measures.
Add a measure Top 5 Customers by Sales. This concatenates the customer names of the top 5 customers by sales separated by a comma.
Add a measure, Sales for New Customers, that calculates sales in a period for new customers - those customers who have not had any purchases before the period.
Add a measure, Running Total Sales, to give the cumulative value.
Add measures Number of Customers, Number of Orders.
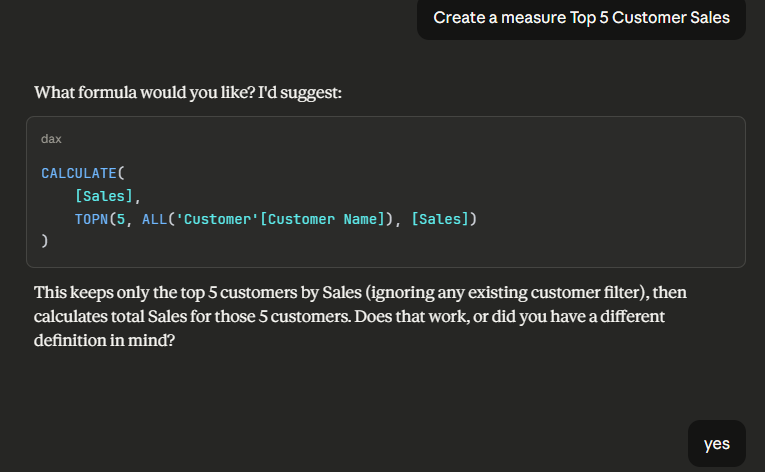
Part of a Claude Desktop Chat with Power BI Modeling MCP server