Zomalex | Data and AI Training
Build a semantic model in Power BI Desktop or Power BI Online
Here are brief instructions on how to build the basic Superstore semantic model either in Power BI Desktop or Power BI Online.
Step 1: Initial tasks
Read the description of the dataset first!
Create a course folder (or use the one you created in the set up phase).
If using Power BI Desktop, download the Excel spreadsheet and move it into the course folder.
If using Power BI Online, copy the link to the spreadsheet URL and use this link to connect to the data.
Step 2: Import the sample data into Power BI with the Query Editor and create the basic model
These instructions work for both Power BI Desktop and Power BI Online. The only difference is that in Power BI Desktop you will connect to the data using the locally downloadedExcel file, whereas in Power BI Online you will connect to the data using the URL of the Excel file.
Import the data in the five Excel tables in the sample data spreadsheet (Customers, Locations, Orders, Products and Transactions) into the Query Editor.
Inspect the tables in the Query Editor. Make any changes necessary.
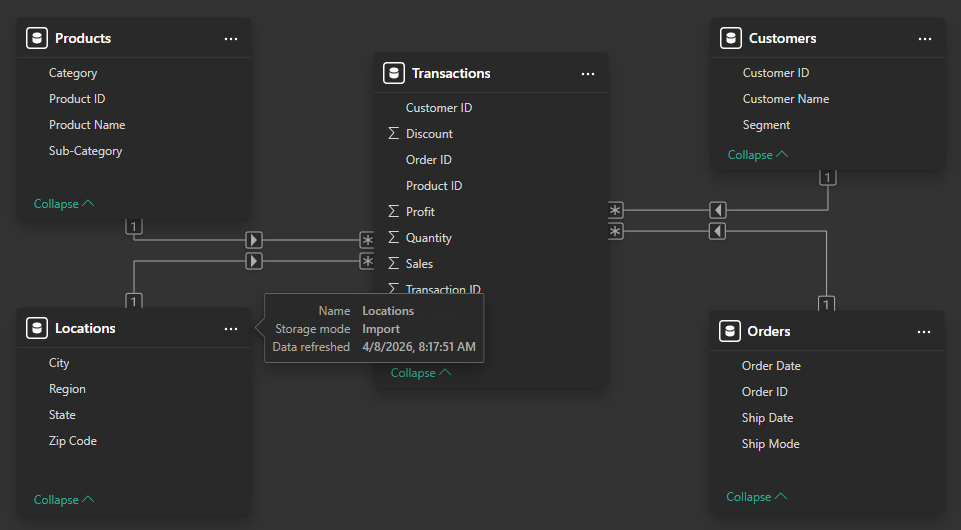
Load the tables into Power BI. View in the Model pane. Check that there is a one to many relationship between each of the dimension tables (Products, Customers, Locations and Orders) and the fact (Transactions) table.
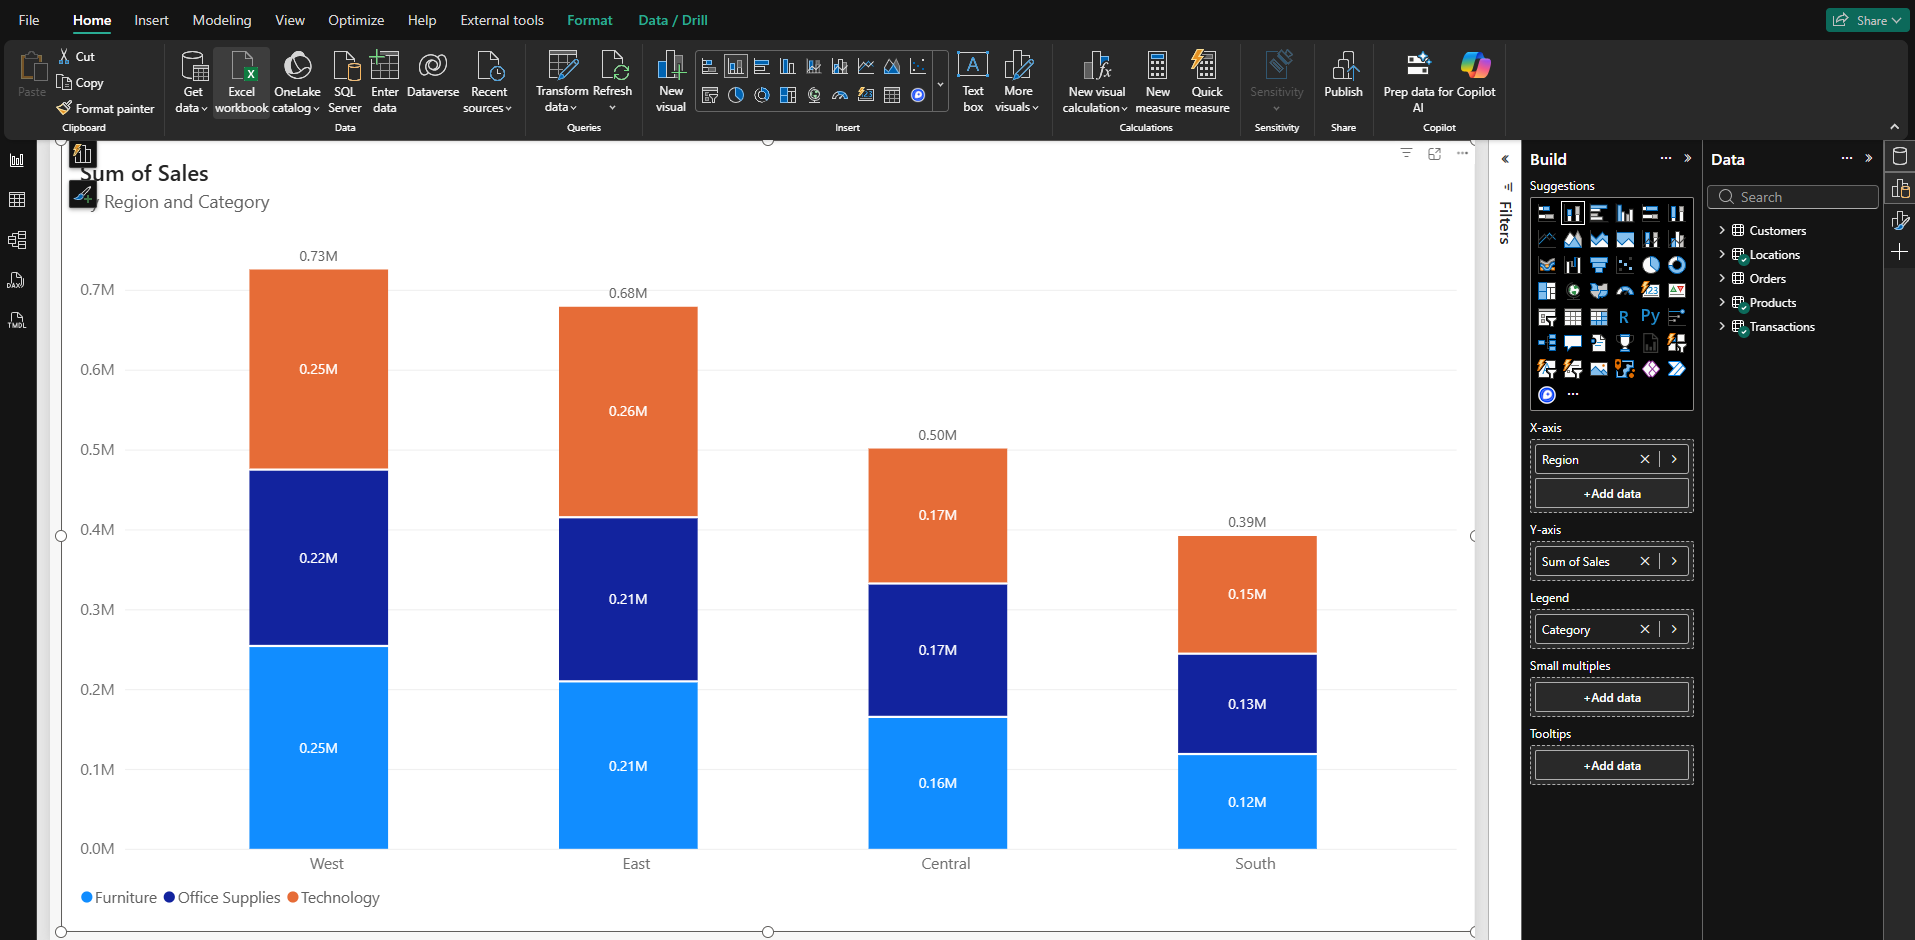
Build a visualisation to smoke test the model
Build a visualisation that uses fields from several tables, for example, a stacked column chart of sales by region (on the axis) and category (in the legend). This is just to perform a basic test of the model.
Alternative method for Step 2(not recommended!): load pre-built PBIX file to skip this step
If you need to skip this step, you can download the pre-built PBIX file from here. If using Power BI Desktop, open this file in Power BI Desktop. If using Power BI Online, upload this file to your OneDrive and then connect to it from Power BI Online, or upload it.
Step 3: Add a Dates table
A Dates (calendar) table is a standard and essential feature of any Power BI model. We need to add this table to our model.
For full details, follow the instructions on the Dates table page. What follows is just a brief summary.
If using Power BI Desktop, apply a TMDL script
In Power BI Desktop’s settings, switch off the Auto-Date Time, at least for the current file.
Open the TMDL view and apply this TMDL script to create a dates table.
The TMDL script builds the schema only. Power BI Desktop will prompt you to refresh the data.
In the Query Editor, filter the dates table to the years 2020 to 2024 inclusive. (This is the date range of the two dates columns in the Orders table.)
If using Power BI Online, import the Dates dataset via the Query Editor, then (later) use the AI to tailor it
Power BI Online does not have a TMDL view, so import the dataset via the Query Editor. Import the dataset, use this link.
Later, we will ask the AI to make a few changes to create the fully featured dates table.
Side note: We can’t currently switch off the Auto-Date Time, or mark a table as a date table in Power BI Online unless we have Tabular Edtor 2 and a workspace on a premium or PPU capacity.
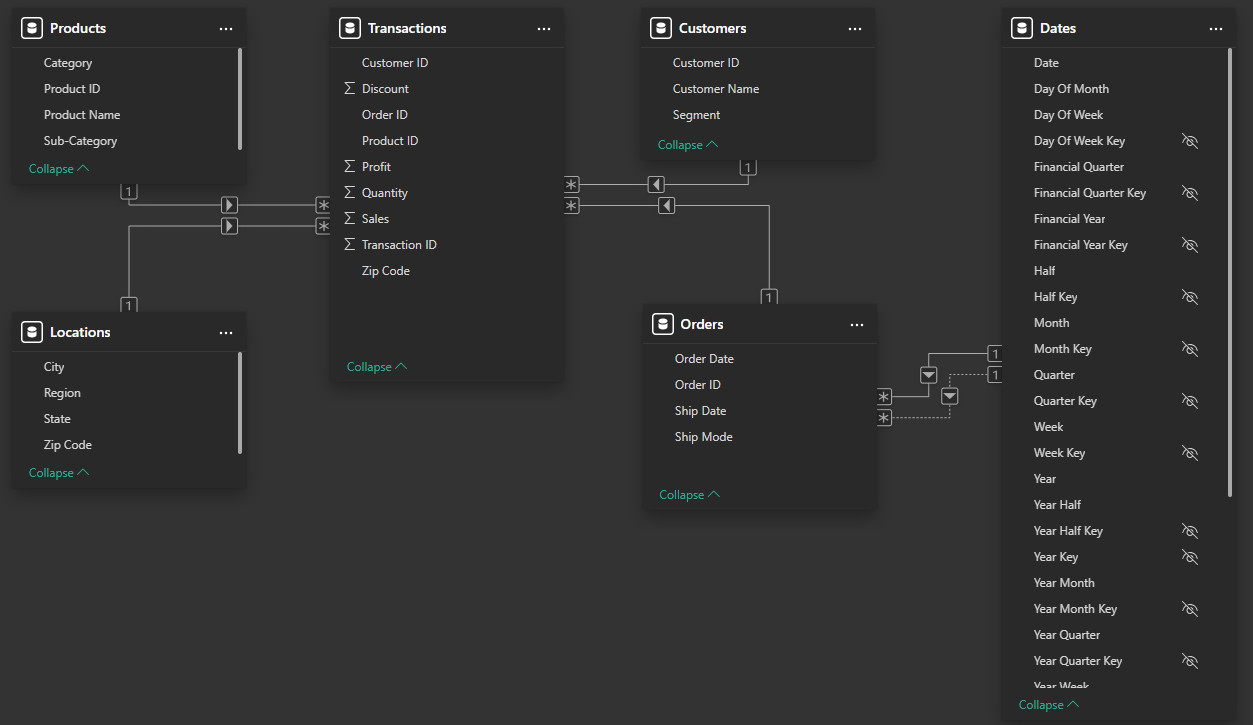
Step 4: Connect the dates table in the model
In the model view, create two relationships:
- an active relationship between the Date column of the Dates table and the Order Date column of the Orders table
- an inactive relationship between the Date column of the Dates table and the Ship Date column of the Orders table
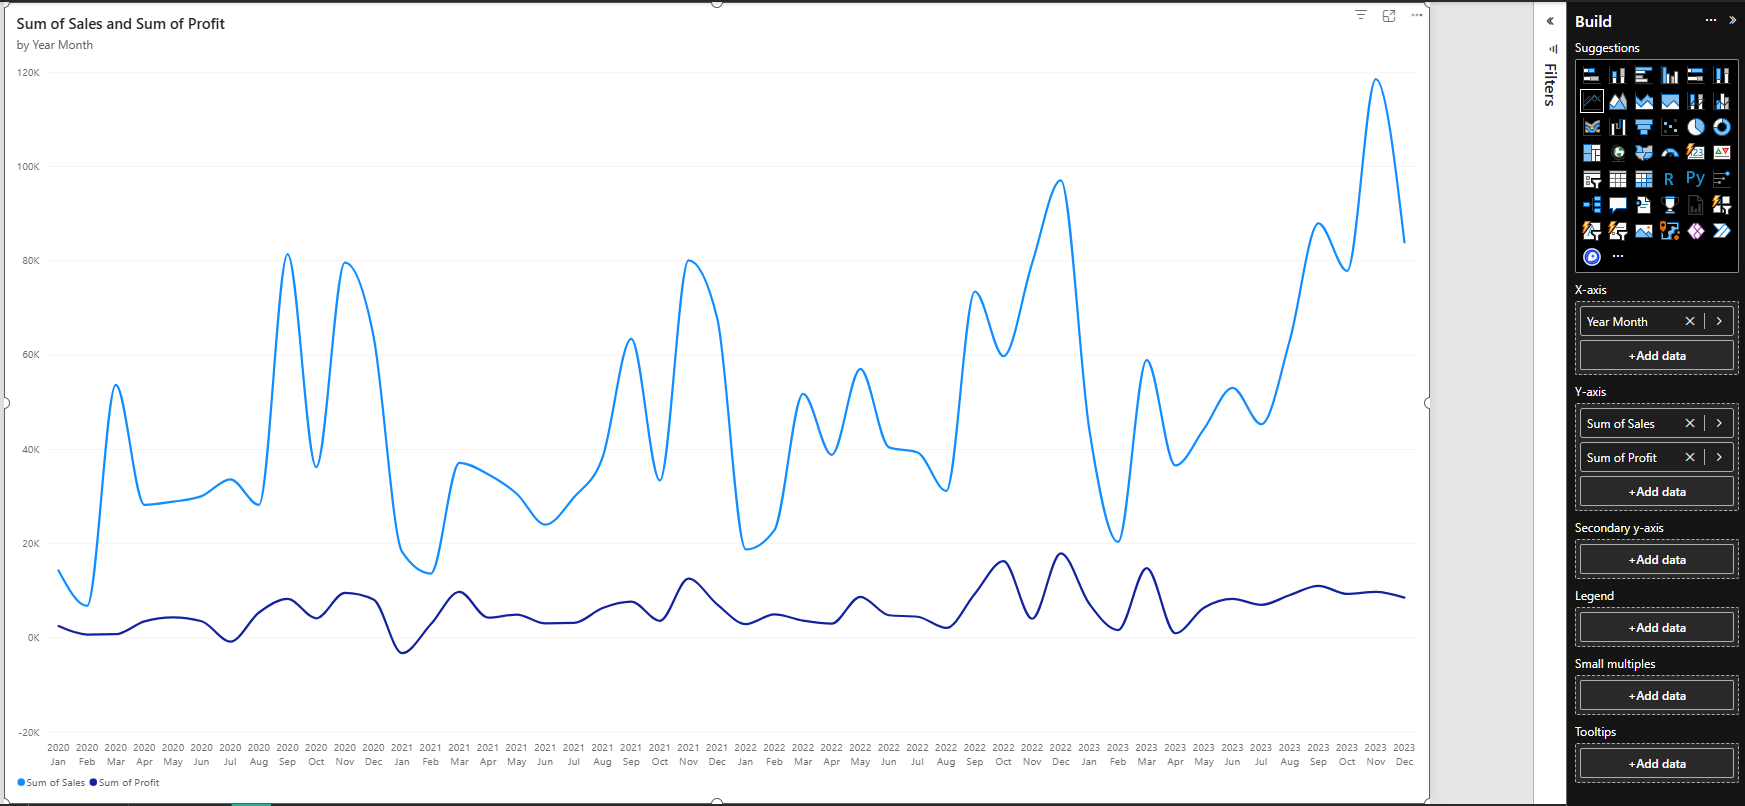
Step 5: Build a visualisation with a column from the dates table to smoke test the model
Build a visualisation with a column from the dates table to test that the Dates table is working correctly - for example, a line chart show sales and profit by month.