Zomalex | Data and AI Training
Power BI Foundation Course Outline
Who should attend
Anybody who is getting started analysing data or building reports with Power BI.
Learning Objectives
Attendees will have a broad understanding of how to explore analyse and visualise data using Power BI and will be comfortable using Power BI Desktop to build reports and dashboards.
Course Content
This is a very practical hands-on course. Attendees will build Power BI visualisations, reports of increasing power and sophistication as the course progresses. Most time will be spent in lab exercises these will use data from public datasets. The course covers the following topics.
- Import data from text/CSV files and spreadsheets
- Clean and transform data – replace or remove bad values, filter the rows, group, summarise, pivot and unpivot data, calculate results
- Build helpful and insightful visuals such as bar charts, line charts, scatter plots, matrix and table visuals, and maps
- Filter data with slicers and the filter pane
- Improve and polish reports: add text, images and other non-data elements to enhance the report; apply conditional formatting e.g. data bars; configure titles, axes, colours, labels.
- Publish content to the Power BI Service
Course Length
1 day (short version) or 2 days (preferred, full version)
Pre-requisites
None
Example case study
One of the possible case studies for this course is an analysis of the scores in a recent series of Strictly, the BBC Saturday night dancing competition. More details are here. By the end of the course, you will have created some reports similar to those below.
Snapshots from the course exercises
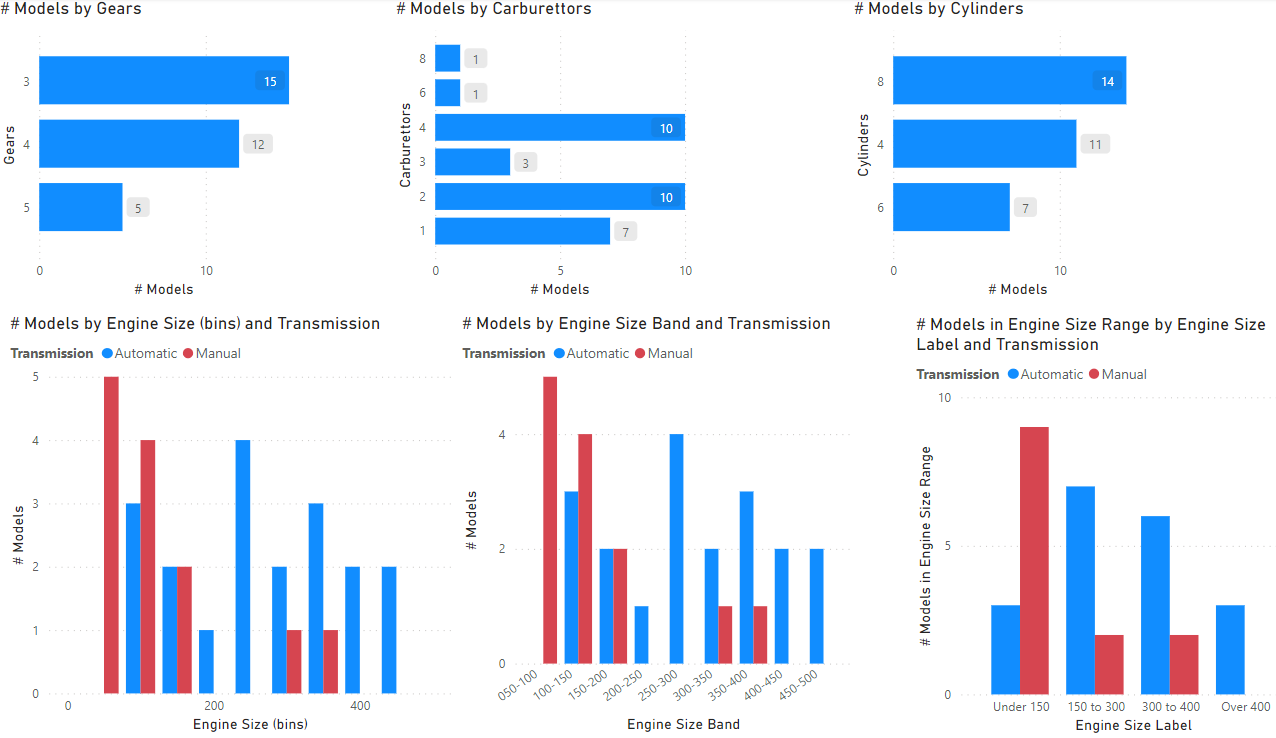
Bar charts built in Power BI Desktop