Zomalex | Data and AI Training
Learning Path
The core courses take you from beginner to advanced:
- the Foundation course introduces Power BI, covering data import, building charts, and publishing a report.
- the Intermediate course follows the foundation course and covers more chart types, cross-filtering interactions, and simple measures.
- the Advanced course focuses on designing a star schema data model and writing DAX measures in DAX query view.
Specialist Courses
Each course focuses on one area in depth:
- the Data Modelling course shows how to relate tables into a star schema — the foundation of a well-performing Power BI model.
- the DAX course focuses on Power BI’s calculation language, covering ratios, running totals, and year-on-year comparisons.
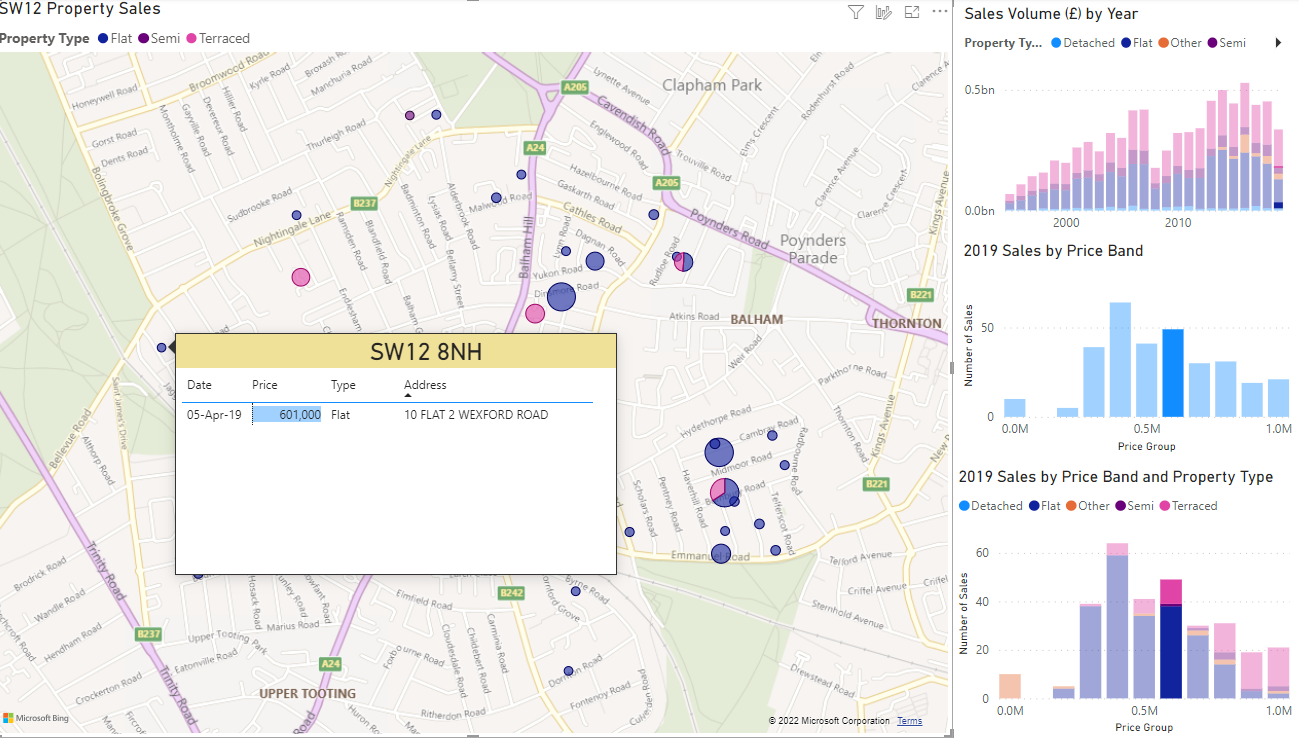
- the Geospatial Maps course shows how to use Power BI’s map visuals to create interactive location-based reports.
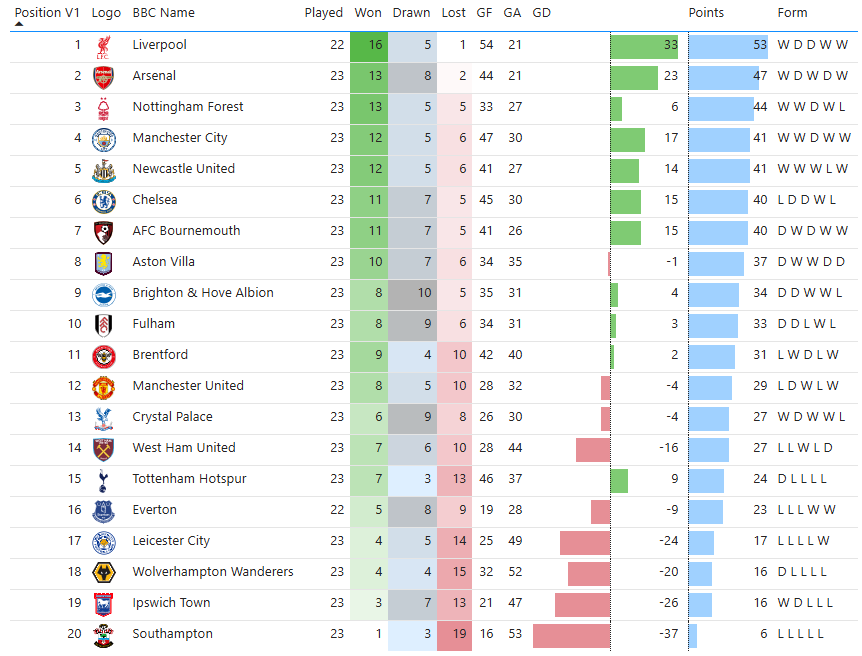
A Premier League table built in Power BI, with conditional formatting showing goal difference, points, and recent form.
A property sales map with cross-filtering: selecting a price band in the bar chart highlights matching properties on the map.