Zomalex | Data and AI Training
Power BI Intermediate Course Outline
Who should attend
Anybody who wants to take their Power BI skills to the next level.
Learning Objectives
Attendees will be able to use Power BI Desktop to analyse and clean data and build insightful reports and dashboards.
Course Content
The course covers following topics related to cleaning and shaping data, reporting, data modelling and DAX (the calculation language of Power BI).
Reporting and visualising data
- Clean and transform data with the Query Editor. Shape data so that it is suitable for analysis; for example, –replace or remove bad values, filter the rows, group, summarise, pivot and unpivot data, calculate results
- Improve charts with field parameters and reference lines e.g. averages, trends, clusters; create drill-though pages and custom tooltips
- Build several chart types: bar charts, line charts, scatter plots, matrix and table visuals, and maps
- Introduction to data models: relationships between tables; fact and dimension tables
- Understand how to incorporate a Dates (calendar) table in the Power BI model and why this is essential.
- Write a simple measure in DAX (the calculation language of Power BI)
- An introduction to using AI assistants to help build Power BI reports.
Cleaning and shaping data with Power Query
- Useful clean and transform data operations in the Query Editor e.g. summarise, pivot and unpivot data
Data modelling
- fact and dimension tables
- star schema patterns
- some essential data modelling techniques from the data modelling course
DAX
- how to write some simple but useful DAX measures and calculations e.g. sums, averages and ratios.
- visual calculations: e.g., running sum, moving average, change on previous, year to date.
- some essential topics from the DAX course
Course Length
1 day (short version) or 2 days (preferred, full version)
Pre-requisites
Basic familiarity with Power BI, for example by having attended the foundation course.
Example case study
One of the possible case studies for this course is to calculate the league table of football’s English Premier League from the match record. More details are here. By the end of the course, you will have created a report similar to the snapshot below.
Snapshots from the course exercises
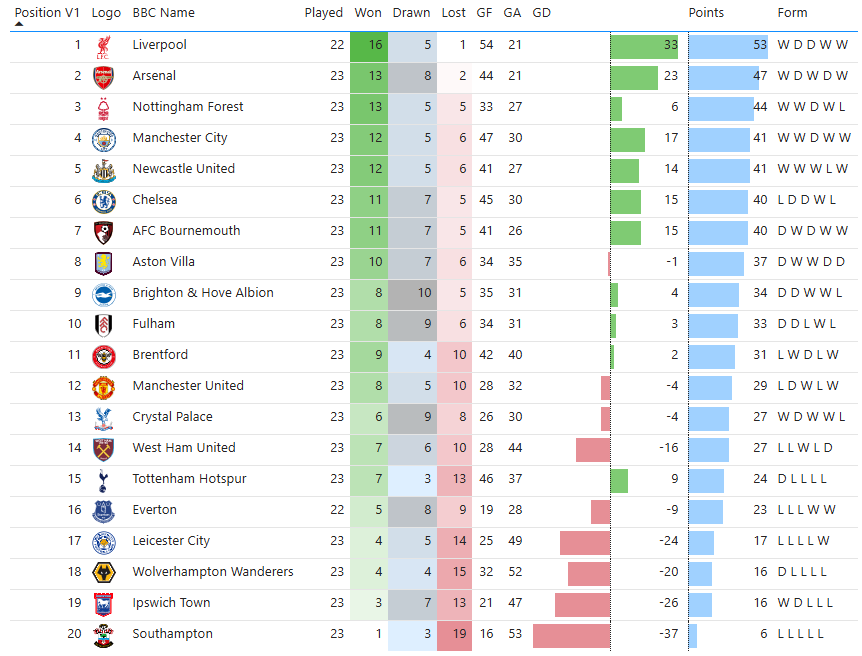
A snapshot of the EPL league table report created in one of the course exercises.